

Question: Please use excel Most quick serve restaurants have two types of stores(1) stores that are owned by the company and (2) stores that are owned
Please use excel
Most quick serve restaurants have two types of stores(1) stores that are owned by the company and (2) stores that are owned by franchisees. Franchisees pay for the opportunity to operate stores under the company's brand in a specified geographic area. The data contains 2019 sales revenue and store counts for the 50 largest US quick serve restaurants. The variables are:
Company Name
Sales Revenue ($ millions)
Store Count Franchisee-
Owned Store Count Company-
Owned Store Count
a. Determine the sample correlation coefficient, r, between Sales Revenue and Store Count.
b. Test the alternative hypothesis that there is a linear relationship between these two variables. What are the test statistic and the p-value for that test statistic? For = .05, what do you conclude about the relationship between the two variables?
c. Now estimate a simple linear regression to predict the Sales Revenue using only Store Count. Write the estimated regression equation.
d. How well does the model fit the dependent variable? Cite the appropriate measure from the regression output, and interpret that measure.
e. What is the fitted slope coefficient? How do you interpret that slope coefficient? Is there a linear relationship between the independent and dependent variables at = .05? Report the relevant test statistic and p-value for that test statistic.
f. Now estimate a multiple linear regression to predict the Sales Revenue using FranchiseeOwned Store Count and Company-Owned Store Count as independent variables (do not include total Store Count in this regression). Write the estimated regression equation.
g. Is the model statistically significant at the = .05 level? Write out your null and alternative hypotheses, the appropriate test statistic, the p-value for that test statistic, and your conclusion, based on that p-value.
h. Which independent variables (if any) are related to the dependent variable Sales Revenue at the = .05 level, in this model? Include relevant values from the Excel output to support your conclusions.
i. Using the fitted slope coefficients from the regression in part (f), what is the expected sales revenue from adding a franchisee-owned store? What is the expected sales revenue from adding a company-owned store?
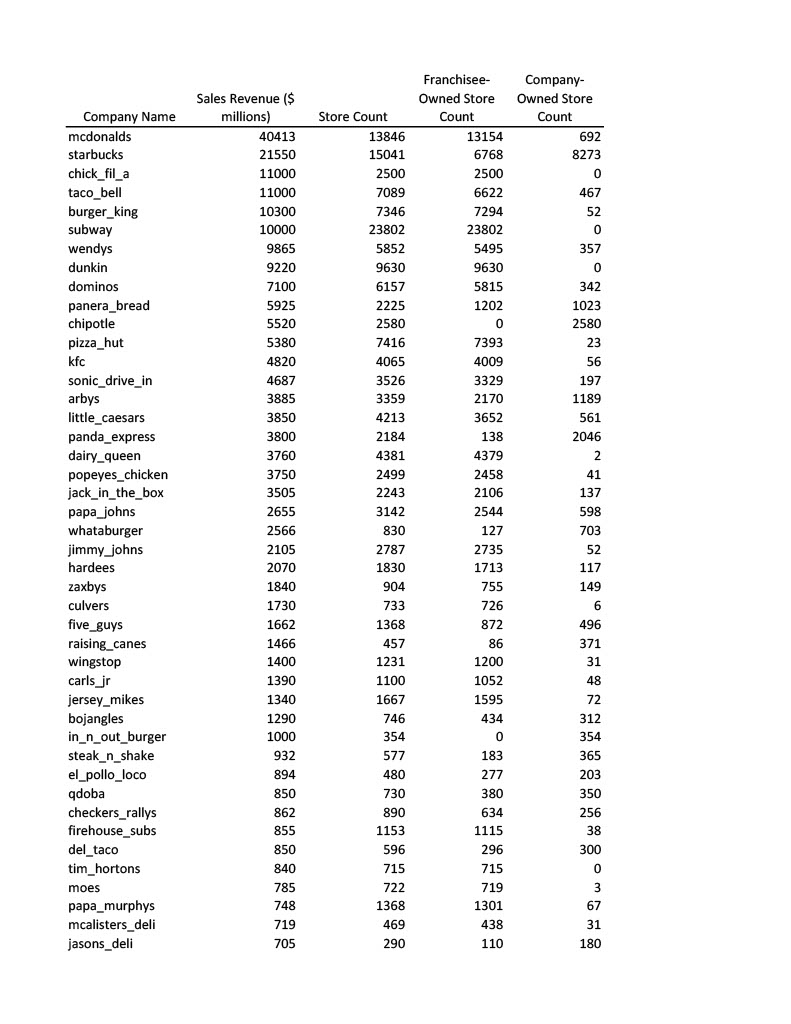
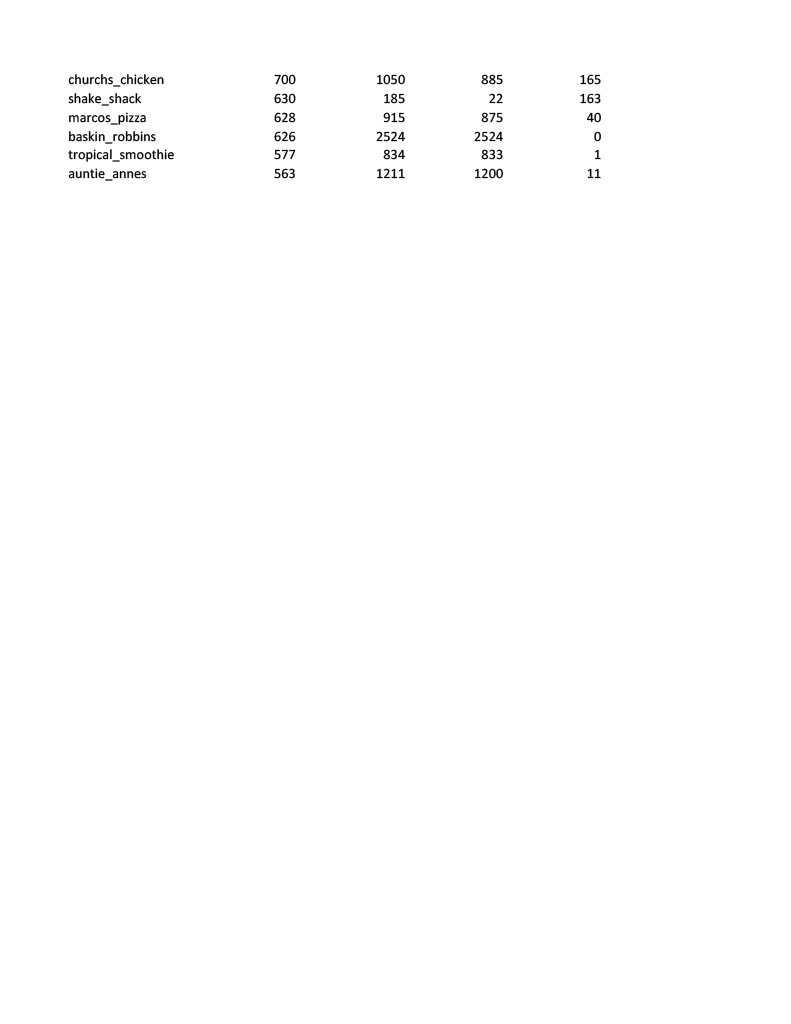
Franchisee- Company- Sales Revenue ($ Owned Store Owned Store Company Name millions) Store Count Count Count mcdonalds 10413 13846 13154 692 starbucks 21550 15041 6768 8273 chick fil_a 11000 2500 2500 taco_bell 11000 7089 6622 467 burger_king 10300 7346 7294 52 subway 10000 23802 23802 0 wendys 9865 5852 5495 357 dunkin 9220 9630 9630 dominos 7100 6157 5815 342 panera_bread 5925 2225 1202 1023 chipotle 5520 2580 2580 pizza_hut 5380 7416 7393 23 kfc 4820 4065 4009 56 sonic_drive_in 4687 3526 3329 197 arby's 3885 3359 2170 1189 little_caesars 3850 4213 3652 561 panda_express 3800 2184 138 2046 dairy_queen 3760 4381 4379 popeyes_chicken 3750 2499 2458 41 jack_in_the_box 3505 2243 2106 137 papa_johns 2655 3142 2544 598 whataburger 2566 830 127 703 jimmy_johns 2105 2787 2735 52 hardees 2070 1830 1713 117 zaxby's 1840 904 755 149 culvers 1730 733 726 five_guys 1662 1368 372 196 raising_canes 1466 457 86 371 wingstop 1400 1231 1200 31 carls_jr 1390 1100 1052 48 jersey_mikes 1340 1667 1595 72 bojangles 1290 746 434 312 in_n_out_burger 1000 354 0 354 steak_n_shake 932 577 183 365 el_pollo_loco 894 480 277 203 qdoba 850 730 380 350 checkers_rallys 862 890 634 256 firehouse_subs 855 1153 1115 38 del_taco 850 596 296 300 tim_hortons 840 715 715 0 moes 785 722 719 papa_murphys 748 1368 1301 67 mcalisters_deli 719 469 438 31 jasons_deli 705 290 110 180
Step by Step Solution
There are 3 Steps involved in it

Get step-by-step solutions from verified subject matter experts