

Question: Please Use Excel Solver to answer this problem. 2. Weekly demand figures at Hot Pizza are as shown. Estimate demand for the next 4 weeks
Please Use Excel Solver to answer this problem.
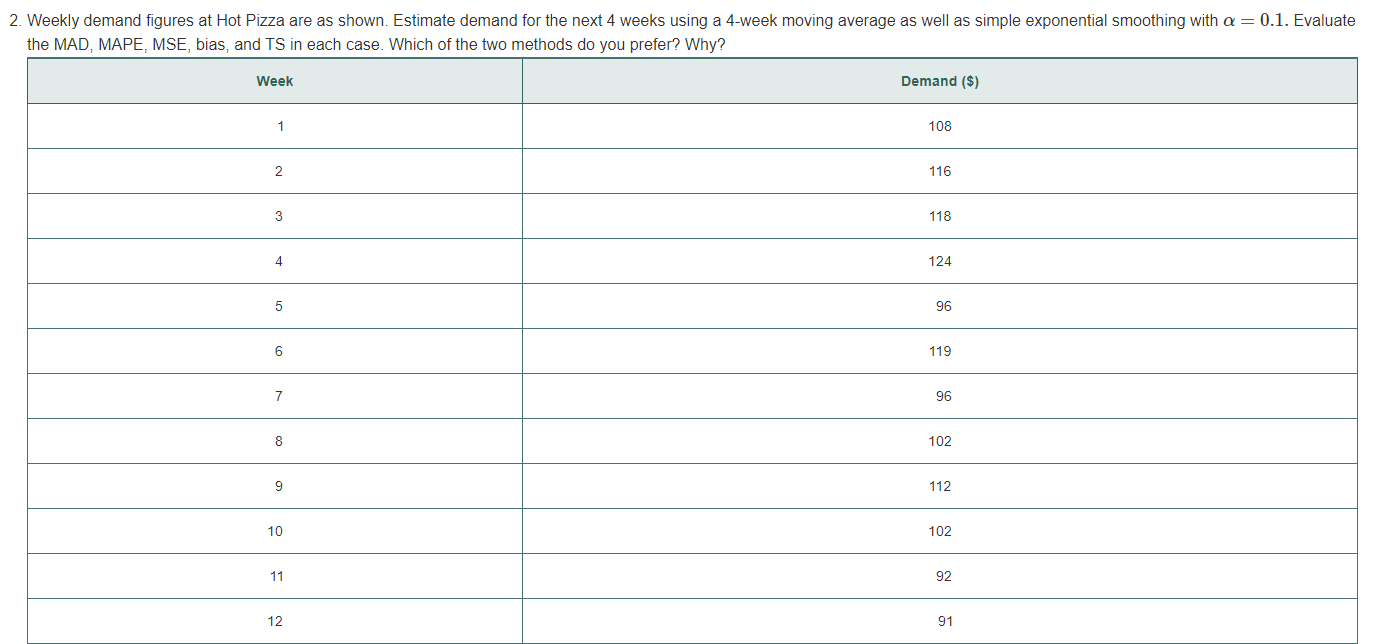
2. Weekly demand figures at Hot Pizza are as shown. Estimate demand for the next 4 weeks using a 4-week moving average as well as simple exponential smoothing with a = 0.1. Evaluate the MAD, MAPE, MSE, bias, and TS in each case. Which of the two methods do you prefer? Why? Week Demand ($) 1 108 2 116 3 118 4 124 5 96 6 119 7 96 8 102 9 112 10 102 11 92 12 91Step by Step Solution
There are 3 Steps involved in it
1 Expert Approved Answer
Step: 1 Unlock

Question Has Been Solved by an Expert!
Get step-by-step solutions from verified subject matter experts
Step: 2 Unlock
Step: 3 Unlock