

Question: please use fourmela for question 4. 3. After collecting data from a manufacturing process, an X-bar chart is constructed as below. Based on the chart:
please use fourmela for question 4. 
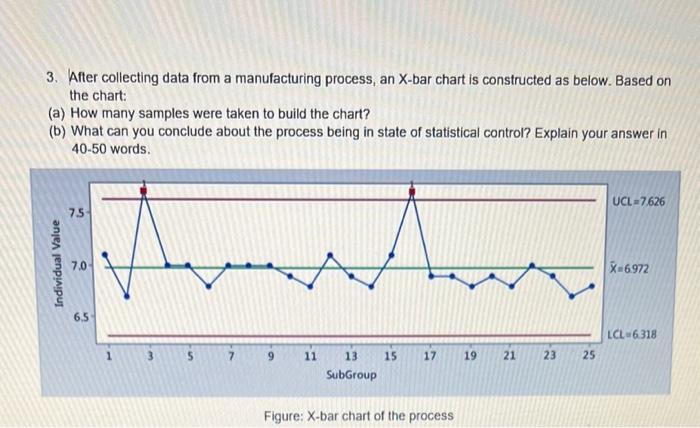
3. After collecting data from a manufacturing process, an X-bar chart is constructed as below. Based on the chart: (a) How many samples were taken to build the chart? (b) What can you conclude about the process being in state of statistical control? Explain your answer in 40-50 words. Figure: X-bar chart of the process
Step by Step Solution
There are 3 Steps involved in it
1 Expert Approved Answer
Step: 1 Unlock

Question Has Been Solved by an Expert!
Get step-by-step solutions from verified subject matter experts
Step: 2 Unlock
Step: 3 Unlock