

Question: 2. (10 points) After collecting data from a manufacturing process, an X-bar chart is constructed as below. Based on the chart: (a) How many samples
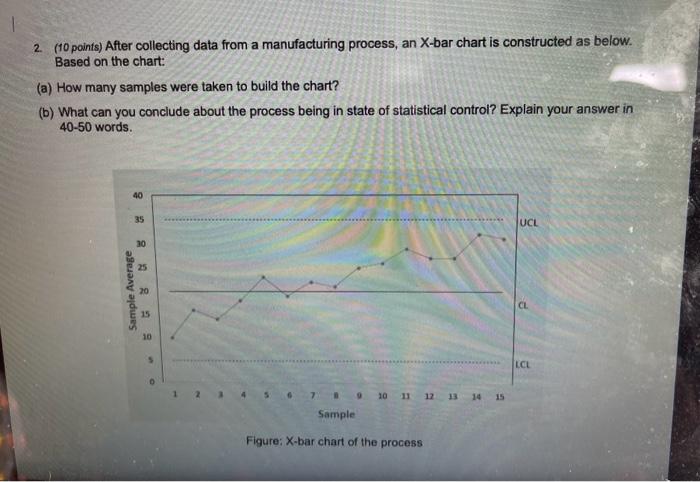
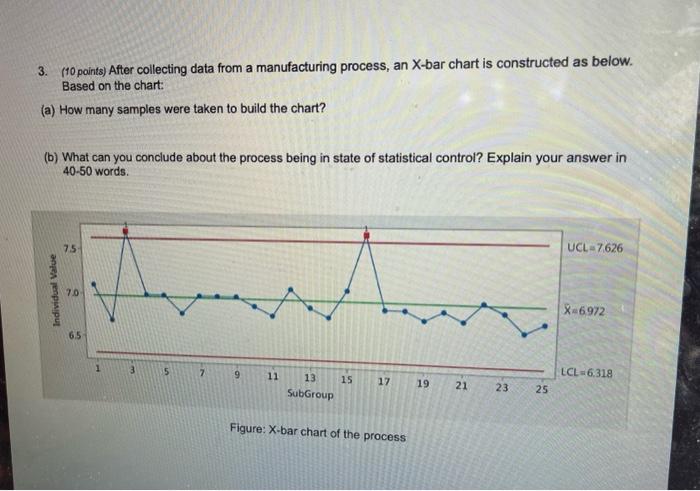
2. (10 points) After collecting data from a manufacturing process, an X-bar chart is constructed as below. Based on the chart: (a) How many samples were taken to build the chart? (b) What can you conclude about the process being in state of statistical control? Explain your answer in 4050 words. 3. (10 paints) After collecting data from a manufacturing process, an X-bar chart is constructed as below. Based on the chart: (a) How many samples were taken to build the chart? (b) What can you conclude about the process being in state of statistical control? Explain your answer in 4050 words. Figure: X-bar chart of the process
Step by Step Solution
There are 3 Steps involved in it

Get step-by-step solutions from verified subject matter experts