

Question: 40 Use the data below to calculate the control limits for an Xbar chart and B chart There are 11 samples with z= 4 in
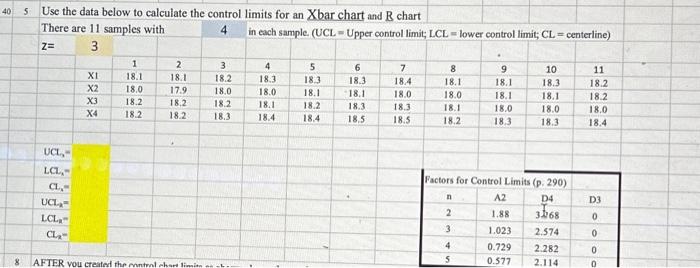
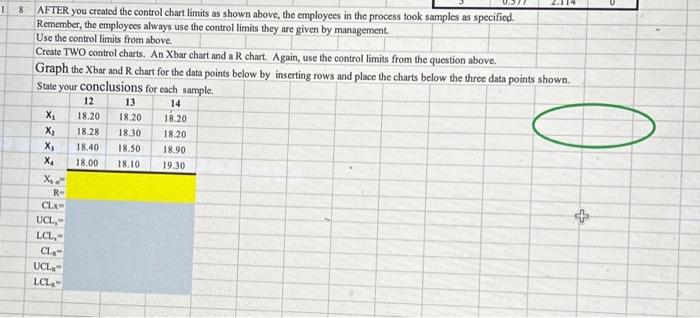
40 Use the data below to calculate the control limits for an Xbar chart and B chart There are 11 samples with z= 4 in each sample. (UCL = Upper control limit; LCL= lower control limit; CL= centerline) 3 \begin{tabular}{|c|c|c|c|} \hline & 1 & 2 & 3 \\ \hlineX1 & 18.1 & 18.1 & 18.2 \\ \hlineX2 & 18.0 & 17.9 & 18.0 \\ \hlineX3 & 18.2 & 18.2 & 18.2 \\ \hlineX4 & 18.2 & 18.2 & 18.3 \\ \hline \end{tabular} 4 18.3 18.0 18.1 18.4 \begin{tabular}{|c|c|c|} \hline 5 & 6 & 7 \\ \hline 18.3 & 18.3 & 18.4 \\ \hline 18.1 & 18.1 & 18.0 \\ \hline 18.2 & 18.3 & 18.3 \\ \hline 18.4 & 18.5 & 18.5 \\ \hline \end{tabular} 9 18.1 18.1 18.0 18.3 10 11 18,3 18.2 VCl3= Factors for Control Limits (p. 290) UCLa= \begin{tabular}{|c|c|c|c|} \hline n & A2 & D4 & D3 \\ \hline 2 & 1.88 & 3J68 & 0 \\ \hline 3 & 1.023 & 2.574 & 0 \\ \hline 4 & 0.729 & 2.282 & 0 \\ \hline 5 & 0.577 & 2.114 & 0 \\ \hline \end{tabular} 8 AFTER you created the control chart limits as shown above, the employees in the process took samples as specified. Remember, the employees always use the control limits they are given by management. Use the control limits from above. Create TWO control charts. An Xbar chart and a R chart. Again, use the control limits from the question above. Graph the Xbar and R chart for the data points below by inserting rows and place the charts below the three data points showr
Step by Step Solution
There are 3 Steps involved in it

Get step-by-step solutions from verified subject matter experts