

Question: Please Use MATLAB 3. (20 points) In Matlab create the plot of the following function from t=0 to 70 min C = 4.84e-0.034 50 and
Please Use MATLAB
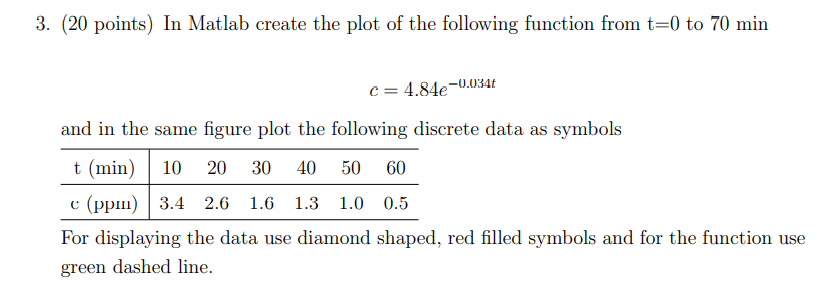
3. (20 points) In Matlab create the plot of the following function from t=0 to 70 min C = 4.84e-0.034 50 and in the same figure plot the following discrete data as symbols t (min) 10 20 30 40 60 c (ppm) 3.4 2.6 1.6 1.3 1.0 0.5 For displaying the data use diamond shaped, red filled symbols and for the function use green dashed line
Step by Step Solution
There are 3 Steps involved in it
1 Expert Approved Answer
Step: 1 Unlock

Question Has Been Solved by an Expert!
Get step-by-step solutions from verified subject matter experts
Step: 2 Unlock
Step: 3 Unlock