

Question: Please use Matlab only. need the steps how to import data to live script 3. Use the text file TSUNJAPMIXED.txt and TSUINDO.txt to import data
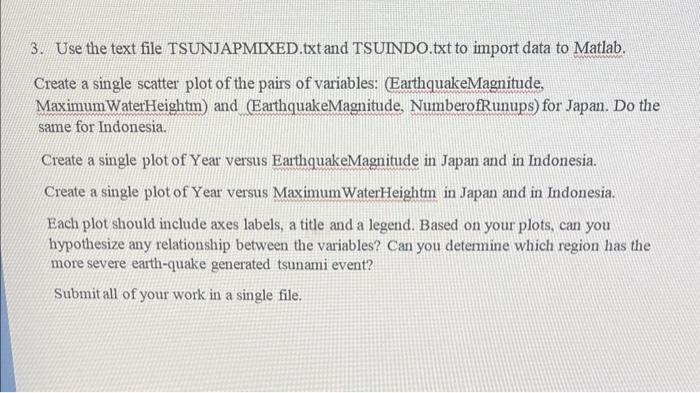
3. Use the text file TSUNJAPMIXED.txt and TSUINDO.txt to import data to Matlab. Create a single scatter plot of the pairs of variables: (EarthquakeMagnitude, MaximumWaterHeightm) and (EarthquakeMagnitude, NumberofRunups) for Japan. Do the same for Indonesia. Create a single plot of Year versus EarthquakeMagnitude in Japan and in Indonesia. Create a single plot of Year versus MaximumWaterHeightm in Japan and in Indonesia. Each plot should include axes labels, a title and a legend. Based on your plots, can you hypothesize any relationship between the variables? Can you determine which region has the more severe earth-quake generated tsunami event? Submit all of your work in a single file
Step by Step Solution
There are 3 Steps involved in it

Get step-by-step solutions from verified subject matter experts