

Question: Please use MATLAB to solve the question. Plot the following equations for an x from 0 to 2pi. Choose an appropriate interval for the x-
 Please use MATLAB to solve the question.
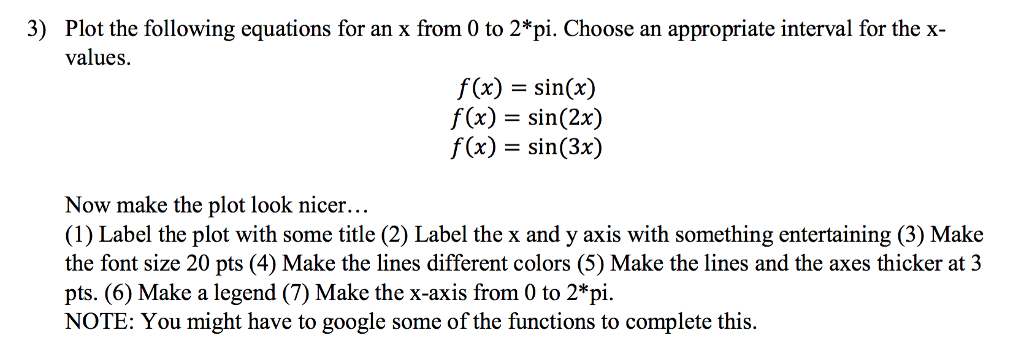
Plot the following equations for an x from 0 to 2"pi. Choose an appropriate interval for the x- values 3) f(x) = sin(x) f(x)sin(2x) f(x) = sin(3x) Now make the plot look nicer... (1) Label the plot with some title (2) Label the x and y axis with something entertaining (3) Make the font size 20 pts (4) Make the lines different colors (5) Make the lines and the axes thicker at 3 pts. (6) Make a legend (7) Make the x-axis from 0 to 2*pi. NOTE: You might have to google some of the functions to complete this
Step by Step Solution
There are 3 Steps involved in it
1 Expert Approved Answer
Step: 1 Unlock

Question Has Been Solved by an Expert!
Get step-by-step solutions from verified subject matter experts
Step: 2 Unlock
Step: 3 Unlock