

Question: Please use R and post the codes. Here is the data file: LifeExpectancies_by_Age_Gender.csv Country M0 M25 M50 M75 W0 W25 W50 W75 Algeria 63 51
Please use R and post the codes.
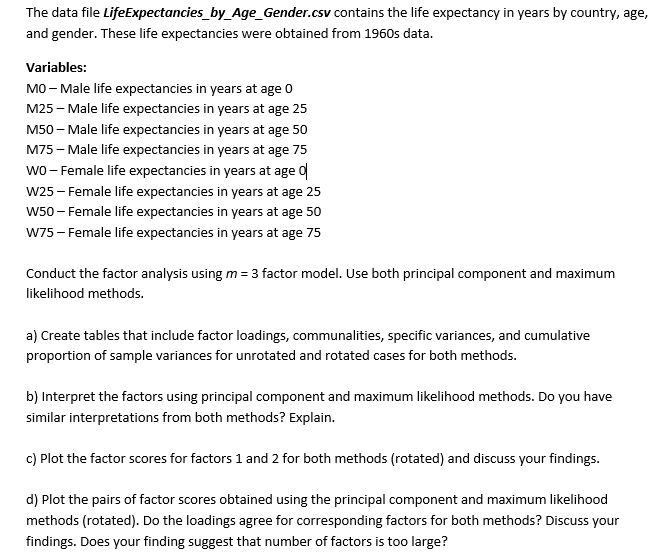
Here is the data file: LifeExpectancies_by_Age_Gender.csv
| Country | M0 | M25 | M50 | M75 | W0 | W25 | W50 | W75 |
| Algeria | 63 | 51 | 30 | 13 | 67 | 54 | 34 | 15 |
| Cameroon | 34 | 29 | 13 | 5 | 38 | 32 | 17 | 6 |
| Madagascar | 38 | 30 | 17 | 7 | 38 | 3 | 20 | 7 |
| Mauritius | 59 | 42 | 20 | 6 | 64 | 46 | 25 | 8 |
| Reunion | 56 | 38 | 18 | 7 | 62 | 46 | 25 | 10 |
| Seychelles | 62 | 44 | 24 | 7 | 69 | 50 | 28 | 14 |
| South_Africa(B) | 50 | 39 | 20 | 7 | 55 | 43 | 23 | 8 |
| South_Africa(W) | 65 | 44 | 22 | 7 | 72 | 50 | 27 | 9 |
| Tunisia | 56 | 46 | 24 | 11 | 63 | 54 | 33 | 19 |
| Canada | 69 | 47 | 24 | 8 | 75 | 53 | 29 | 10 |
| Costa_Rica | 65 | 48 | 26 | 9 | 68 | 50 | 27 | 10 |
| Diminican_Republic | 64 | 50 | 28 | 11 | 66 | 51 | 29 | 11 |
| El_Salvador | 56 | 44 | 25 | 10 | 61 | 48 | 27 | 12 |
| Greenland | 60 | 44 | 22 | 6 | 65 | 45 | 25 | 9 |
| Grenada | 61 | 45 | 22 | 8 | 65 | 49 | 27 | 10 |
| Gautemala | 49 | 40 | 22 | 9 | 51 | 41 | 23 | 8 |
| Honduras | 59 | 42 | 22 | 6 | 61 | 43 | 22 | 7 |
| Jamaica | 63 | 44 | 23 | 8 | 67 | 48 | 26 | 9 |
| Mexico | 59 | 44 | 24 | 8 | 63 | 46 | 25 | 8 |
| Nicaragua | 65 | 48 | 28 | 14 | 68 | 51 | 29 | 13 |
| Panama | 65 | 48 | 26 | 9 | 67 | 49 | 27 | 10 |
| Trinidad(62) | 64 | 63 | 21 | 7 | 68 | 47 | 25 | 9 |
| Trinidad(67) | 64 | 43 | 21 | 6 | 68 | 47 | 24 | 8 |
| United_States(66) | 67 | 45 | 23 | 8 | 74 | 51 | 28 | 10 |
| United_States(NW66) | 61 | 40 | 21 | 10 | 67 | 46 | 25 | 11 |
| United_States(W66) | 68 | 46 | 23 | 8 | 75 | 52 | 29 | 10 |
| United_States(67) | 67 | 45 | 23 | 8 | 74 | 51 | 28 | 10 |
| Argentina | 65 | 46 | 24 | 9 | 71 | 51 | 28 | 10 |
| Chile | 59 | 43 | 23 | 10 | 66 | 49 | 27 | 12 |
| Comumbia | 58 | 44 | 24 | 9 | 62 | 47 | 25 | 10 |
| Ecuador | 57 | 46 | 28 | 9 | 60 | 49 | 28 | 11 |
Step by Step Solution
There are 3 Steps involved in it
1 Expert Approved Answer
Step: 1 Unlock

Question Has Been Solved by an Expert!
Get step-by-step solutions from verified subject matter experts
Step: 2 Unlock
Step: 3 Unlock