

Question: Please use R to do the simulations and post the code. what additional information do you need about the question? 8. Suppose we have a
Please use R to do the simulations and post the code.
what additional information do you need about the question?
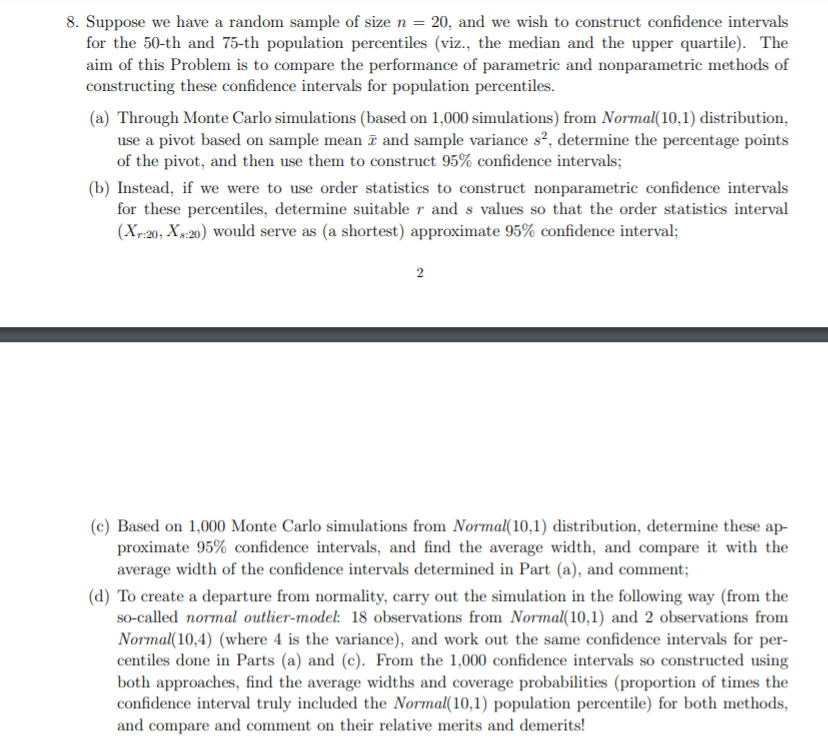
8. Suppose we have a random sample of size n = 20, and we wish to construct confidence intervals for the 50-th and 75-th population percentiles (viz., the median and the upper quartile). The aim of this Problem is to compare the performance of parametric and nonparametric methods of constructing these confidence intervals for population percentiles. (a) Through Monte Carlo simulations (based on 1,000 simulations) from Normal(10,1) distribution, use a pivot based on sample mean and sample variance s?, determine the percentage points of the pivot, and then use them to construct 95% confidence intervals; (b) Instead, if we were to use order statistics to construct nonparametric confidence intervals for these percentiles, determine suitable r and s values so that the order statistics interval (X.:20, X.:20) would serve as a shortest) approximate 95% confidence interval; 2 (c) Based on 1,000 Monte Carlo simulations from Normal(10,1) distribution, determine these ap- proximate 95% confidence intervals, and find the average width, and compare it with the average width of the confidence intervals determined in Part (a), and comment; (d) To create a departure from normality, carry out the simulation in the following way (from the so-called normal outlier-model: 18 observations from Normal(10,1) and 2 observations from Normal( 10,4) (where 4 is the variance), and work out the same confidence intervals for per- centiles done in Parts (a) and (c). From the 1,000 confidence intervals so constructed using both approaches, find the average widths and coverage probabilities (proportion of times the confidence interval truly included the Normal(10,1) population percentile) for both methods, and compare and comment on their relative merits and demerits! 8. Suppose we have a random sample of size n = 20, and we wish to construct confidence intervals for the 50-th and 75-th population percentiles (viz., the median and the upper quartile). The aim of this Problem is to compare the performance of parametric and nonparametric methods of constructing these confidence intervals for population percentiles. (a) Through Monte Carlo simulations (based on 1,000 simulations) from Normal(10,1) distribution, use a pivot based on sample mean and sample variance s?, determine the percentage points of the pivot, and then use them to construct 95% confidence intervals; (b) Instead, if we were to use order statistics to construct nonparametric confidence intervals for these percentiles, determine suitable r and s values so that the order statistics interval (X.:20, X.:20) would serve as a shortest) approximate 95% confidence interval; 2 (c) Based on 1,000 Monte Carlo simulations from Normal(10,1) distribution, determine these ap- proximate 95% confidence intervals, and find the average width, and compare it with the average width of the confidence intervals determined in Part (a), and comment; (d) To create a departure from normality, carry out the simulation in the following way (from the so-called normal outlier-model: 18 observations from Normal(10,1) and 2 observations from Normal( 10,4) (where 4 is the variance), and work out the same confidence intervals for per- centiles done in Parts (a) and (c). From the 1,000 confidence intervals so constructed using both approaches, find the average widths and coverage probabilities (proportion of times the confidence interval truly included the Normal(10,1) population percentile) for both methods, and compare and comment on their relative merits and demerits
Step by Step Solution
There are 3 Steps involved in it

Get step-by-step solutions from verified subject matter experts