

Question: Please use R for this problem and provide R code and output Use the following R code to access data from the Getting To know
Please use R for this problem and provide R code and output
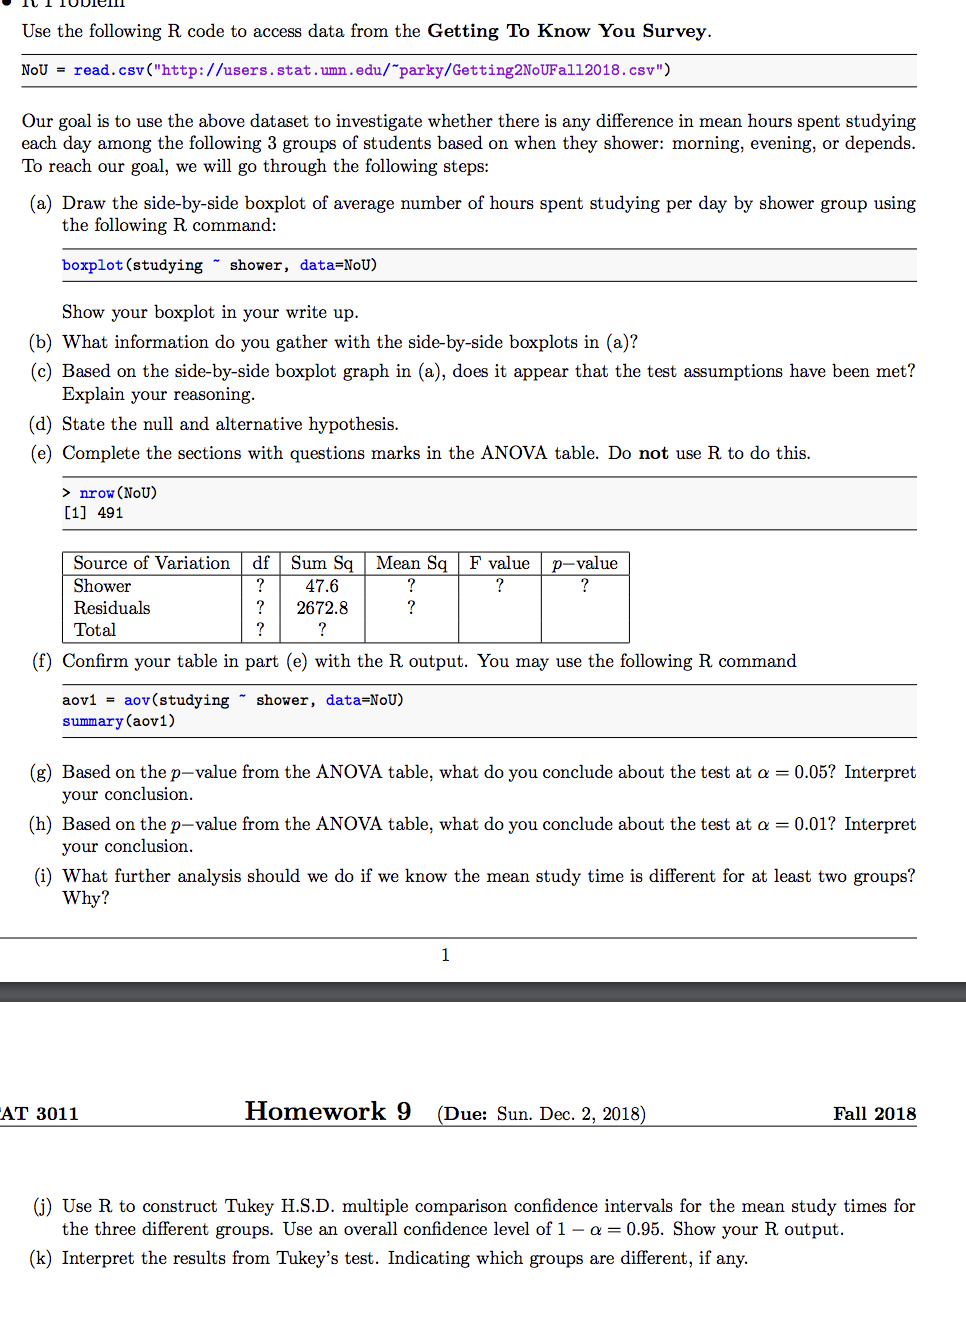
Use the following R code to access data from the Getting To know You Survey NOU = read CSV ( http : / users stat . umm edu / parky / Getting YOUFall2018 csy " ) Our goal is to use the above dataset to investigate whether there there is any difference in mean hours spent studying each day among the following 3 groups of students based on when they shower : morning , evening , or depends To reach our goal , we will go through the following steps ( a ) Draw the side-by - side boxpl at of average number of hours spent studying per day by shower group using the following R comman boxplot ( studying " shower , data = Not ) Show your boxplot in your write up ( b ) What info Imation do you gather with the side- by - side boxplots in ( a ) ( c ) Based on the side - by -side boxplot graph in ( a ) , does it appear that the test assumptions have been met ? Explain your reasoning ( a ) State the null and alternative hypothesis ( e ) Complete the sections with questions marks in the ANOVA table . Do not use R to do this ATOW ( NOW ) [ 17 491 Source of Variation of Sum Sq Mean Sq F value p - value Shower ? | 47.6 Residuals ? | 26728 ( f ) Confirm your table in part ( e ) with the R output . You may use the following R command gov ( studying shower , data = Not ) summary ( aovi ) ( 8 ) Based on the p - value from the ANOVA table , wh what do you conclude about the test at a = 0.05 ? Interpret your conclusion ( h ) Based on the p - value from the A NOVA table , what do you conclude about the test at a = 0.01 ? Interpret your conclusion ( 1 ) What further analysis should we do if we know the mean study time is different for at least two groups ? Why AT 3011 Homework 9 ( Due : Sun . Dec . 2 2018 ) Fall 2018 ( 3 ) Use R to construct Tukey H .S . D . multiple comparison confidence intervals for the mean study times for the three different groups . Use an overall confidence level of 1 - a = 095 . Show your R output ( K ) Interpret the results from Tukey's test . Indicating which groups are different , if any
Step by Step Solution
There are 3 Steps involved in it

Get step-by-step solutions from verified subject matter experts