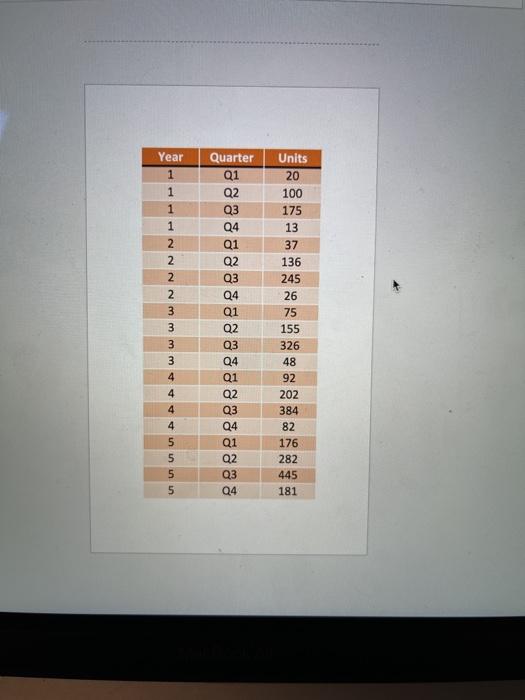
Question: please use the data and answer question 3 only on excel with the steps, thank you INFO 300 Project 1 A company sells a logo-branded

please use the data and answer question 3 only on excel with the steps, thank you please use the data and answer question 3 only on
please use the data and answer question 3 only on
INFO 300 Project 1 A company sells a logo-branded coffeemaker that is sold in some of the larger retail stores. The file Project 1 Data_dsx shows quarterly unit sales of this product for the past 5 years. Question 1 - 10 pts a. Plot this data on a line chart with quarters from years 1-5 on the horizontal axis. (25 pts) Make sure to display the data labels. (25 pts) What does this data tell you? (5 pts) Line Chart should be on the same worksheet as the data. Question 2 -30 pts Ignore any trend or seasonality in the data. a. Assume the company uses 3-quarterly moving averages to make forecasts. Make forecasts for each quarter starting Q4 Year 1 all the way through Q4 Year 5. (5 pts) b. Suppose the company uses 3-quarterly weighted moving averages to make forecasts. Make quarterly forecasts starting with Q4 Year 1 all the way through Q4 Year 5. Assume the company uses quarterly moving averages with weights 0.6 (most recent), 0.3 (next), and 0.1 (oldest). (5 pts) c. Using Mean Absolute Percent Error compare the accuracies of the two sets of forecast. Explain which one is better 3 quarter moving average of 3 quarter weighted moving average? (15 pts) d. Develop a Line Chart to showcase your results comparing the two forecast models used. (5 pts) Question 3 - 30 points Again ignore any trend or seasonality in the data. Suppose the company uses exponential smoothing to make forecasts. 2. What are the forecasts for periods Q2 Year I through Q4 Year 5 assuming alpha=0.3. Assume that the forecast for Q1 Year I was 25 units. (5 pts) b. What are the forecasts for periods Q2 Year 1 through Q4 Year 5 assuming alpha=0.8. Assume that the forecast for Q2 Year I was 25 units. (5 pts) c. Compare the accuracies of the forecasts in (a) and (b) using Mean Absolute Percent Error. Which value of alpha gives us the better forecasts? (15 pts) d. Develop a Line Chart to showcase your results comparing the two forecast models used. (5 pts) Quarter Q1 Q2 Year 1 1 1 1 2 2 2 Q3 Q4 Q1 Q2 Q3 2 3 3 3 3 4 Q4 Q1 Q2 Q3 Q4 Q1 Units 20 100 175 13 37 136 245 26 75 155 326 48 92 202 384 82 176 282 445 181 Q2 4 4 4 5 5 5 5 Q3 Q4 Q1 Q2 Q3 Q4

Step by Step Solution

There are 3 Steps involved in it

1 Expert Approved Answer
Step: 1 Unlock blur-text-image
Question Has Been Solved by an Expert!

Get step-by-step solutions from verified subject matter experts

Step: 2 Unlock
Step: 3 Unlock

Students Have Also Explored These Related General Management Questions!