

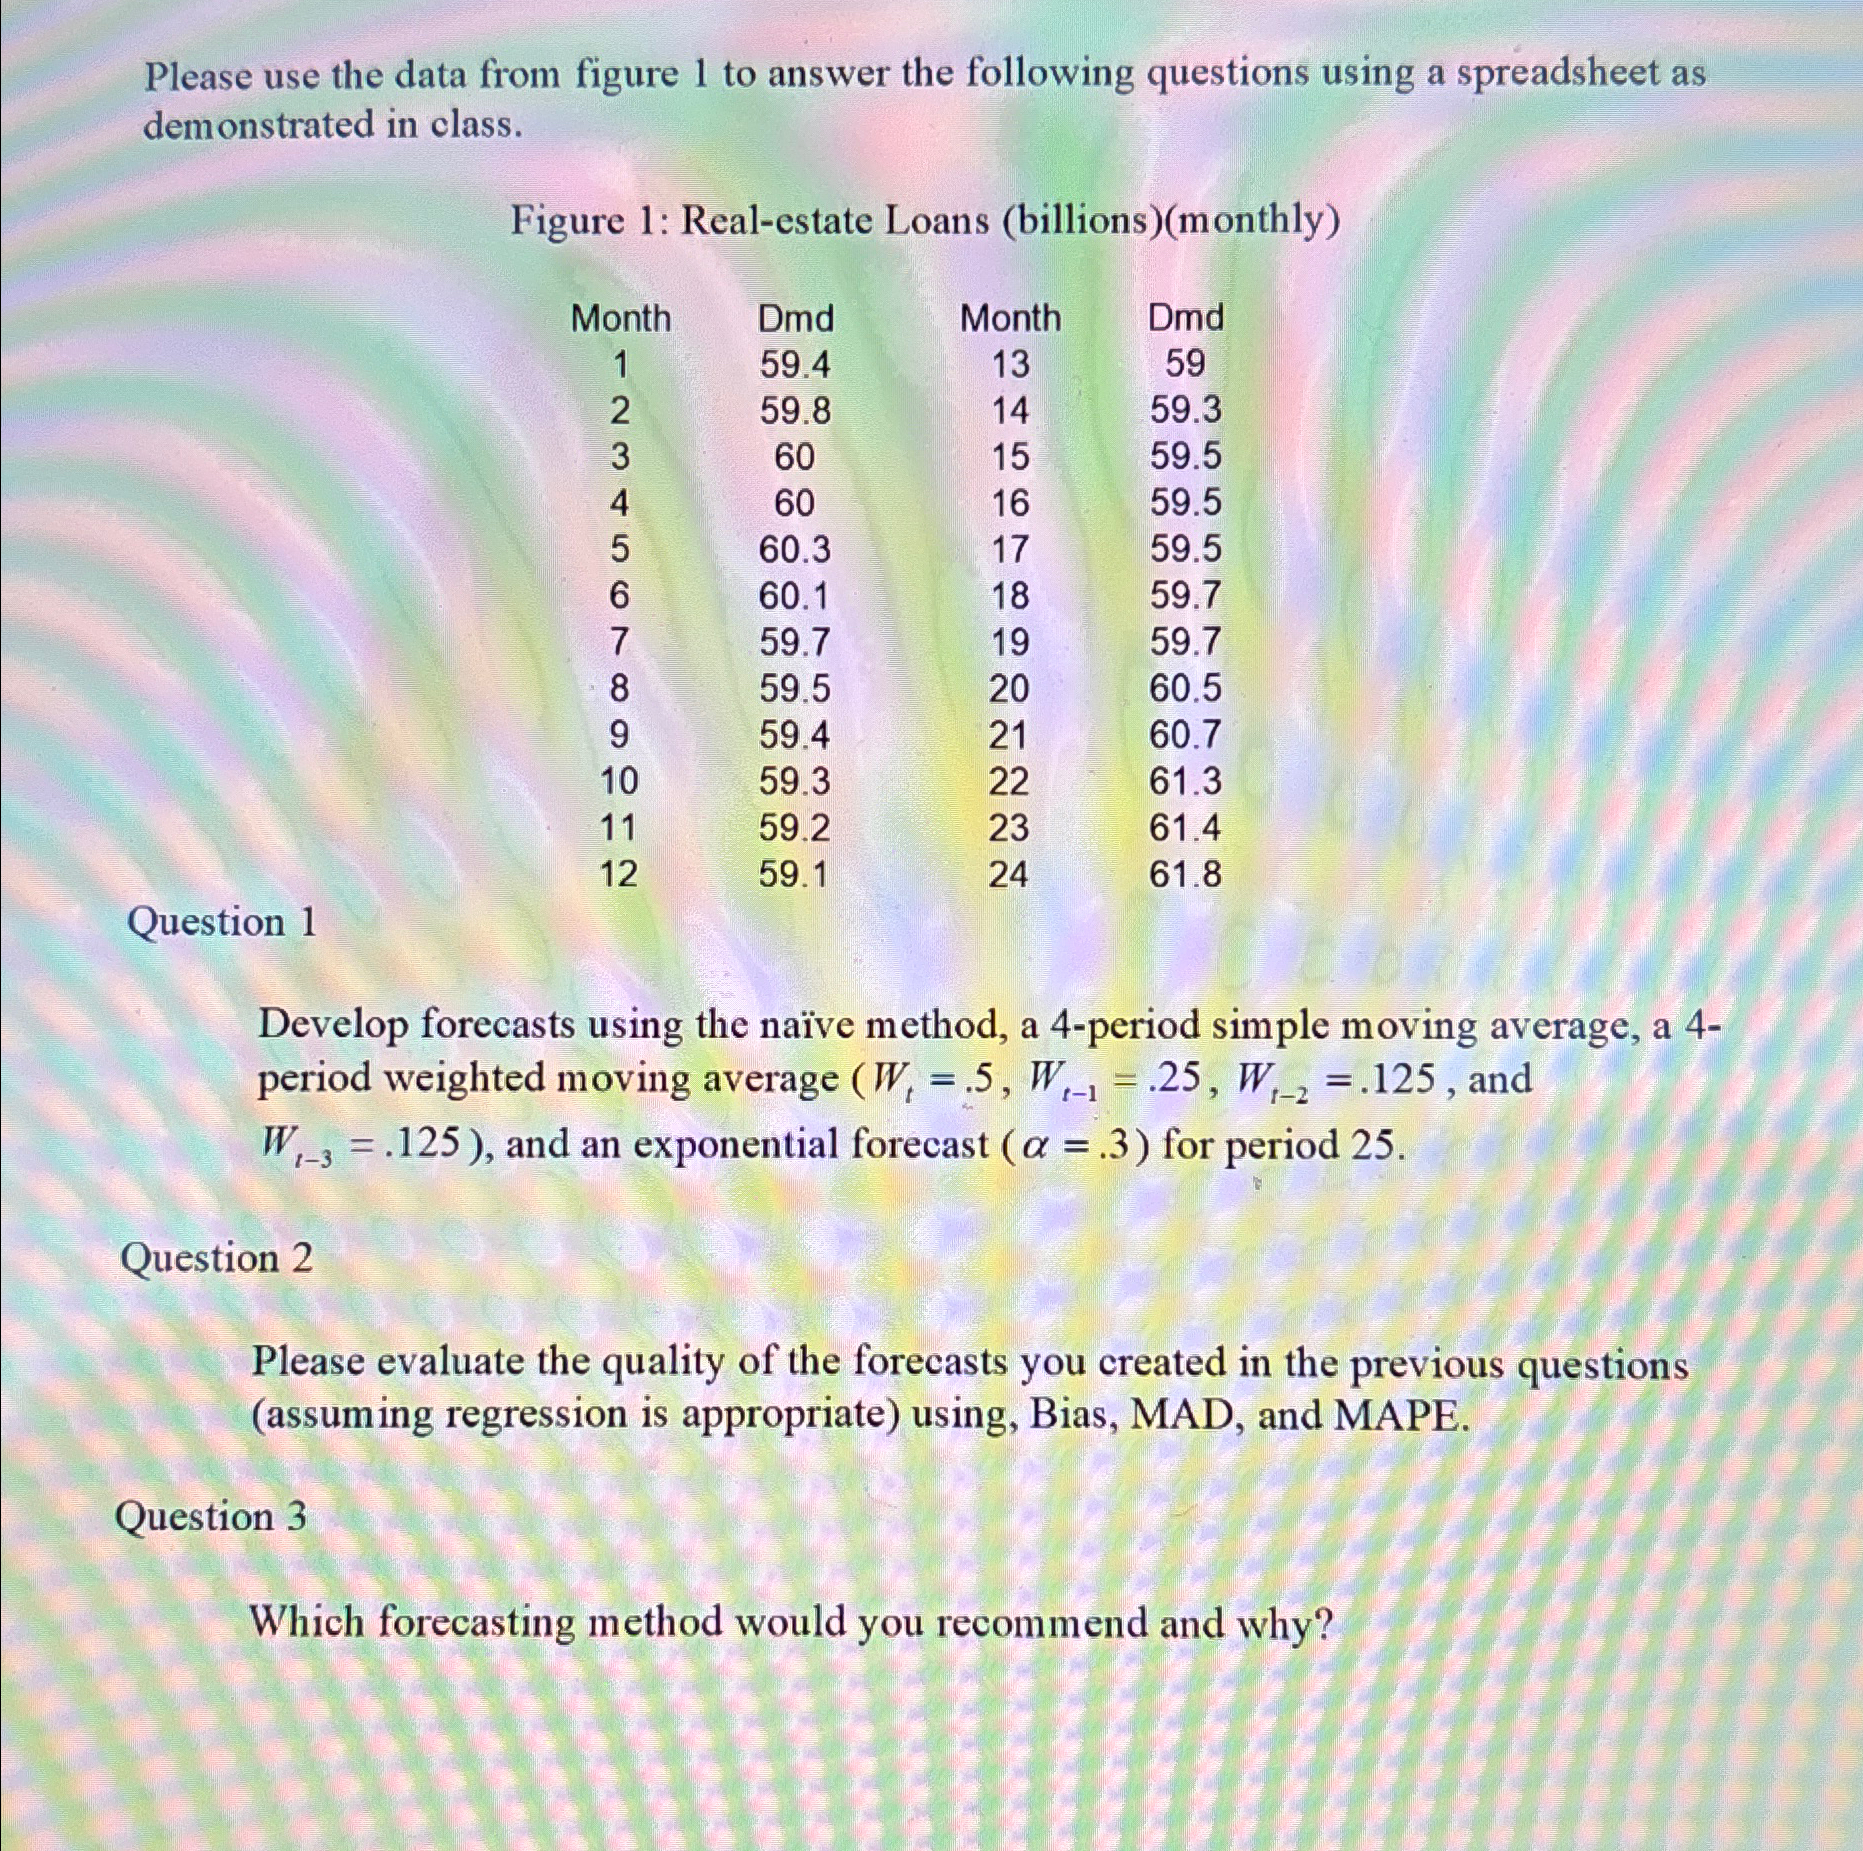
Question: Please use the data from figure 1 to answer the following questions using a spreadsheet as demonstrated in class. Figure 1 : Real - estate
Please use the data from figure to answer the following questions using a spreadsheet as demonstrated in class.
Figure : Realestate Loans billionsmonthly
tableMonthDmdMonth,Dmd
Question
Develop forecasts using the nave method, a period simple moving average, a period weighted moving average and : and an exponential forecast for period
Question
Please evaluate the quality of the forecasts you created in the previous questions assuming regression is appropriate using, Bias, MAD, and MAPE.
Question
Which forecasting method would you recommend and why?
Step by Step Solution
There are 3 Steps involved in it
1 Expert Approved Answer
Step: 1 Unlock

Question Has Been Solved by an Expert!
Get step-by-step solutions from verified subject matter experts
Step: 2 Unlock
Step: 3 Unlock