

Question: please use the graphs to compete part 1 & 2 for a like and thumbs up :) A Contractor is using a crawler CAT D7H
please use the graphs to compete part 1 & 2 for a like and thumbs up :) 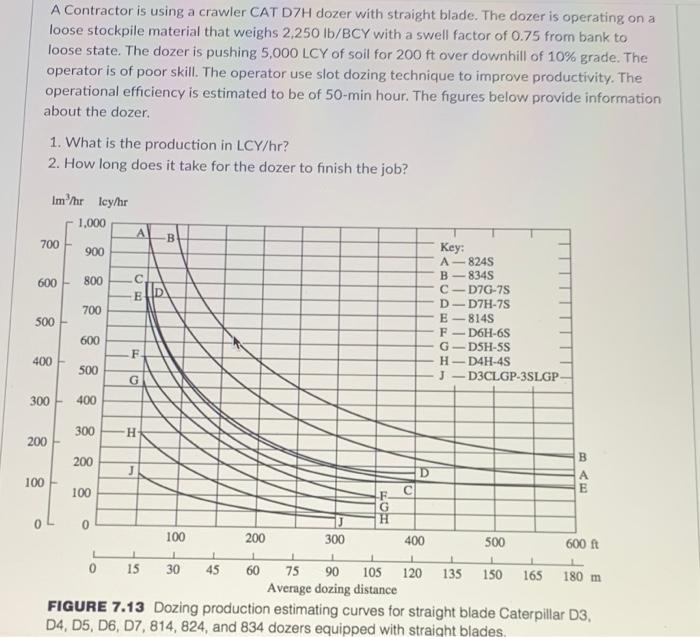
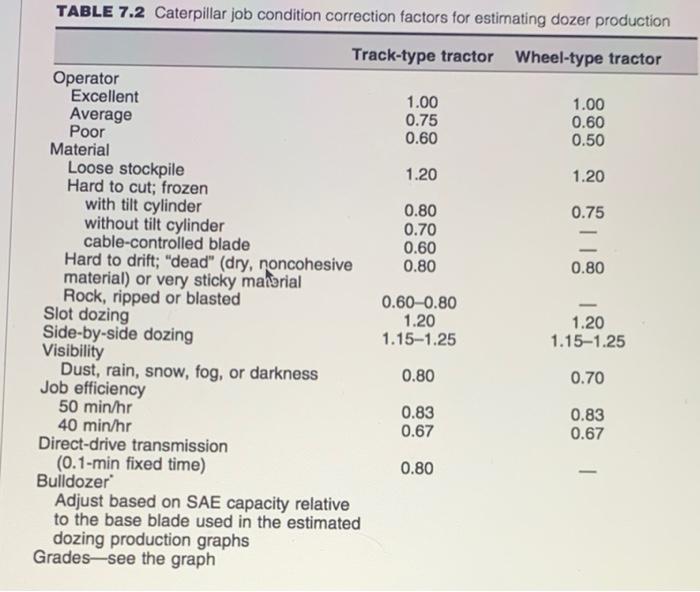
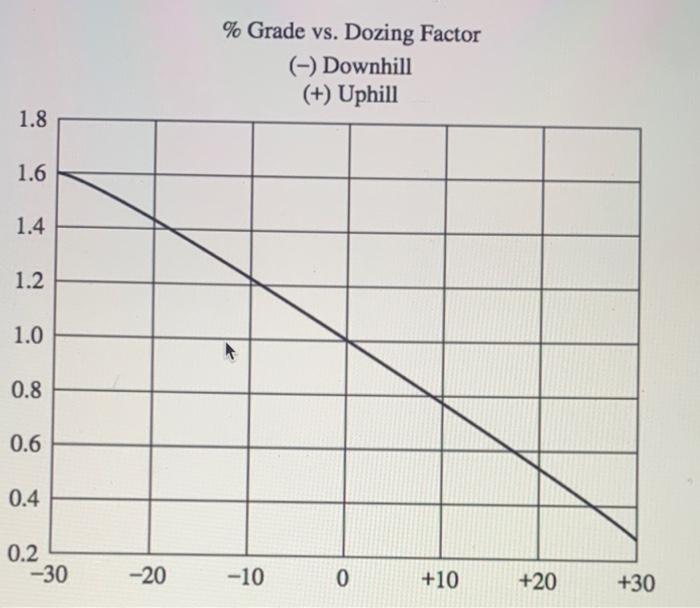
A Contractor is using a crawler CAT D7H dozer with straight blade. The dozer is operating on a loose stockpile material that weighs 2,250 lb/BCY with a swell factor of 0.75 from bank to loose state. The dozer is pushing 5,000 LCY of soil for 200 ft over downhill of 10% grade. The operator is of poor skill. The operator use slot dozing technique to improve productivity. The operational efficiency is estimated to be of 50-min hour. The figures below provide information about the dozer 1. What is the production in LCY/hr? 2. How long does it take for the dozer to finish the job? Im/hr Icy/hr 1,000 ! 700 900 - 600 800 C E 700 ; A8245 B-8345 C-D7G-75 D-D7H-75 E-8145 F-D6H-6S GDSH-SS H-D4H-45 J-D3CLGP-3SLGP 500 600 F 400 500 G 300 400 300 H 200 200 B J 100 100 E 0 0 100 1 200 300 400 500 600 R 0 15 30 45 60 75 90 105 120 135 150 165 180 m Average dozing distance FIGURE 7.13 Dozing production estimating curves for straight blade Caterpillar D3, D4, D5, D6, D7, 814, 824, and 834 dozers equipped with straight blades TABLE 7.2 Caterpillar job condition correction factors for estimating dozer production Track-type tractor Wheel-type tractor Operator Excellent 1.00 1.00 Average 0.75 0.60 Poor 0.60 0.50 Material Loose stockpile 1.20 1.20 Hard to cut; frozen with tilt cylinder 0.80 0.75 without tilt cylinder 0.70 cable-controlled blade 0.60 Hard to drift; "dead" (dry, roncohesive 0.80 0.80 material) or very sticky maharial Rock, ripped or blasted 0.60-0.80 Slot dozing 1.20 1.20 Side-by-side dozing 1.15-1.25 1.15-1.25 Visibility Dust, rain, snow, fog, or darkness 0.80 0.70 Job efficiency 50 min/hr 0.83 0.83 40 min/hr 0.67 0.67 Direct-drive transmission (0.1-min fixed time) 0.80 Bulldozer Adjust based on SAE capacity relative to the base blade used in the estimated dozing production graphs Grades-see the graph % Grade vs. Dozing Factor (-) Downhill (+) Uphill 1.8 1.6 1.4 1.2 1.0 0.8 0.6 0.4 0.2 -30 -20 -10 0 +10 +20 +30 Step by Step Solution
There are 3 Steps involved in it
1 Expert Approved Answer
Step: 1 Unlock

Question Has Been Solved by an Expert!
Get step-by-step solutions from verified subject matter experts
Step: 2 Unlock
Step: 3 Unlock