

Question: Please Use the Match Function and show the formulas on the chart. S20 A B D E F G I J 7 Original investment $300
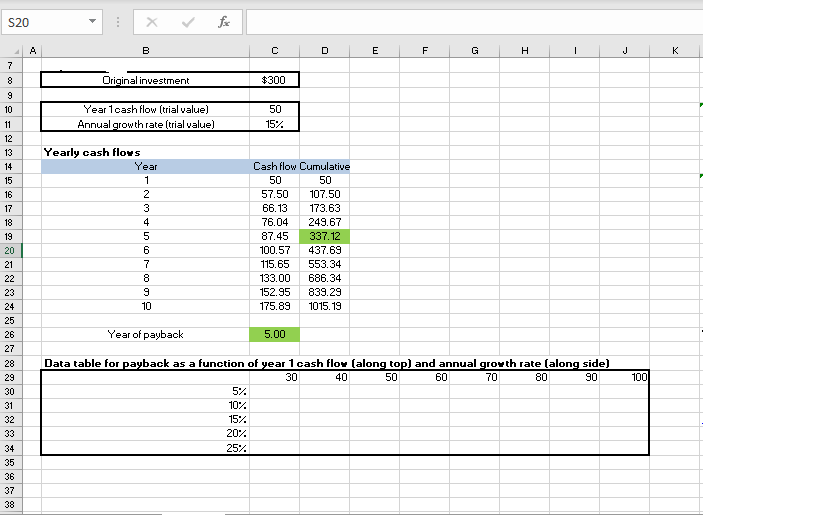 Please Use the Match Function and show the formulas on the chart.
Step by Step Solution
There are 3 Steps involved in it
1 Expert Approved Answer
Step: 1 Unlock

Question Has Been Solved by an Expert!
Get step-by-step solutions from verified subject matter experts
Step: 2 Unlock
Step: 3 Unlock