

Question: Please use the provided graph to fill in the blanks. Thanks [The following information applies to the questions displayed below.] Simon Company's year-end balance sheets

![[The following information applies to the questions displayed below.] Simon Company's year-end](https://s3.amazonaws.com/si.experts.images/answers/2024/06/66768798e5636_99266768798c24e8.jpg)


Please use the provided graph to fill in the blanks. Thanks
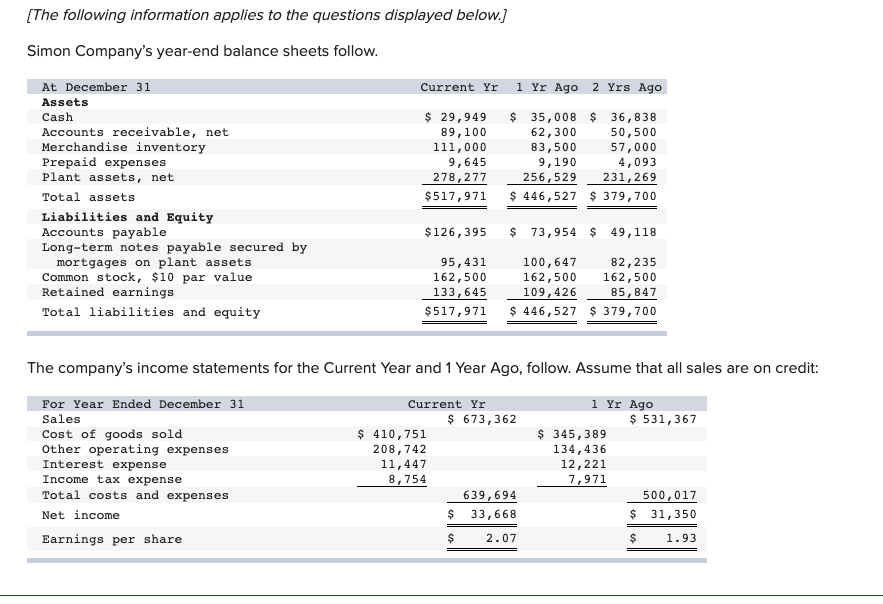
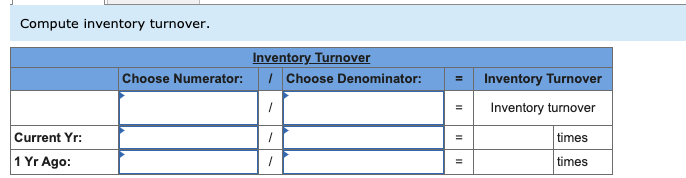
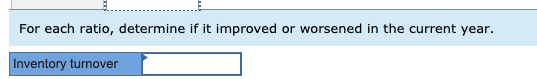

[The following information applies to the questions displayed below.] Simon Company's year-end balance sheets follow. At December 31 Current Yr 1 Yr Ago 2 Yrs Ago Assets Cash $ 29,949 $ 35,008 $ 36,838 Accounts receivable, net 89 , 100 62,300 50,500 Merchandise inventory 111, 000 83,500 57,000 Prepaid expenses 9, 645 9 , 190 4,093 Plant assets, net 278, 277 256,529 231, 269 Total assets $517, 971 $ 446,527 $ 379, 700 Liabilities and Equity Accounts payable $126, 395 $ 73,954 $ 49, 118 Long-term notes payable secured by mortgages on plant assets 95, 431 100, 647 82, 235 Common stock, $10 par value 162,500 162,500 162,500 Retained earnings 133, 645 109, 426 85, 847 Total liabilities and equity $517,971 $ 446, 527 $ 379, 700 The company's income statements for the Current Year and 1 Year Ago, follow. Assume that all sales are on credit: For Year Ended December 31 Current Yr 1 Yr Ago Sales $ 673, 362 $ 531, 367 Cost of goods sold $ 410, 751 $ 345, 389 Other operating expenses 208, 742 134, 436 Interest expense 11, 447 12, 221 Income tax expense 8 , 754 7,971 Total costs and expenses 639, 694 500, 017 Net income $ 33, 668 $ 31, 350 Earnings per share S 2. 07 $ 1.93Compute inventory turnover. Inventory Turnover Choose Numerator: / Choose Denominator: Inventory Turnover Inventory turnover Current Yr: times 1 Yr Ago: timesFor each ratio, determine if it improved or worsened in the current year. Inventory turnover(3-a) Compute inventory turnover. (3-b) For each ratio, determine if it improved or worsened in the current year
Step by Step Solution
There are 3 Steps involved in it

Get step-by-step solutions from verified subject matter experts