

Question: PLEASE USE THE TEMPLATES PROVIDED. THANK YOU !!! c E F G A B c. Liquidity Ratios 2 3 2018 2017 1111 Working Capital $130,500
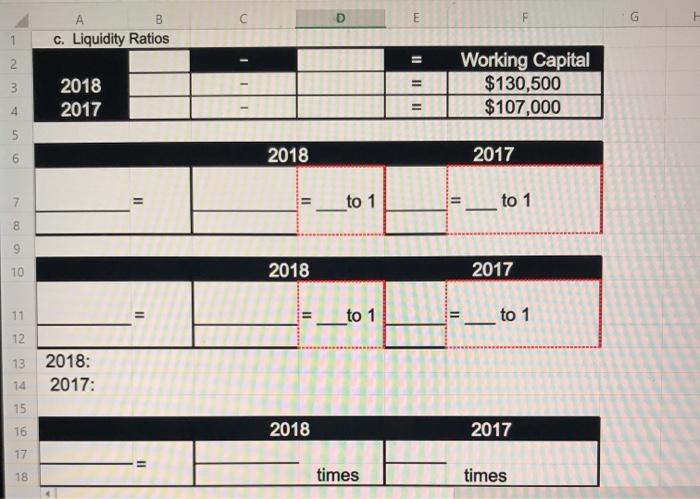
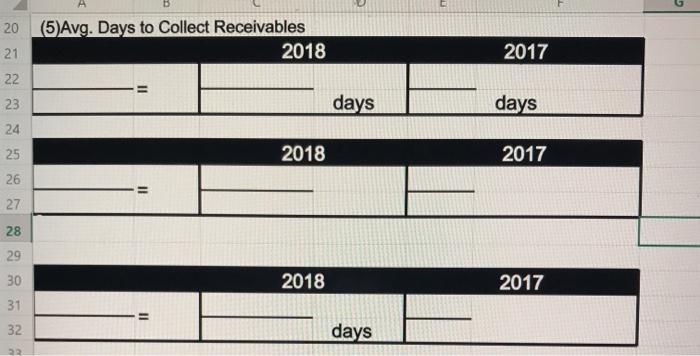
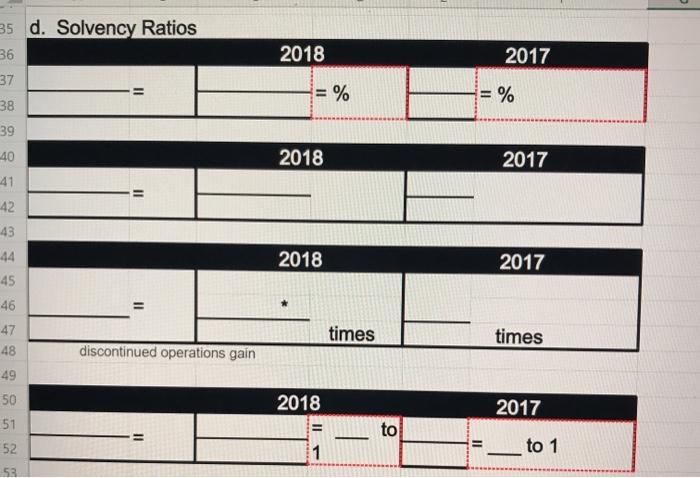
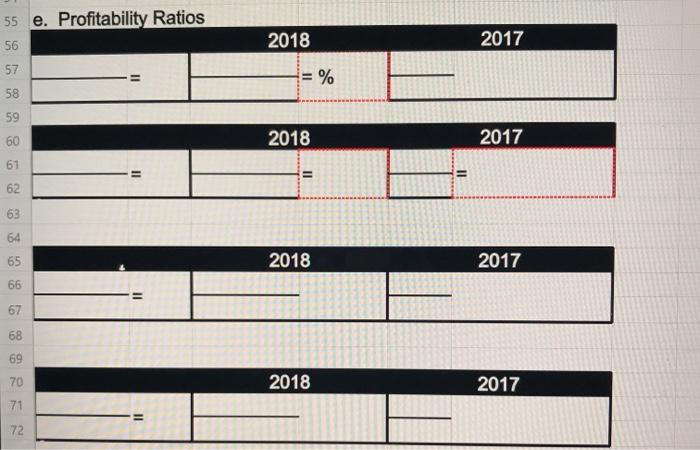
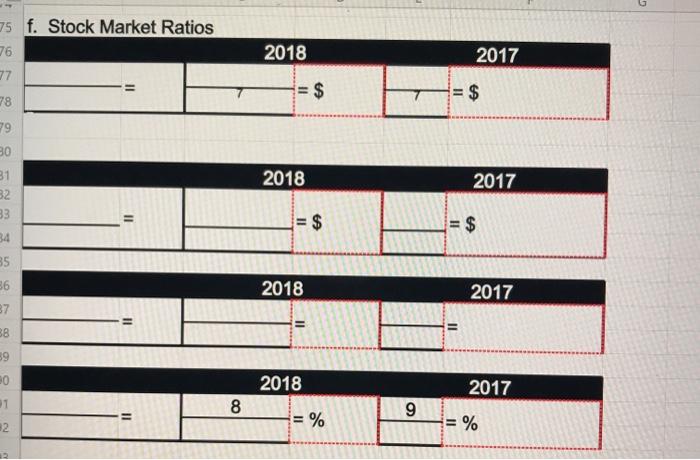
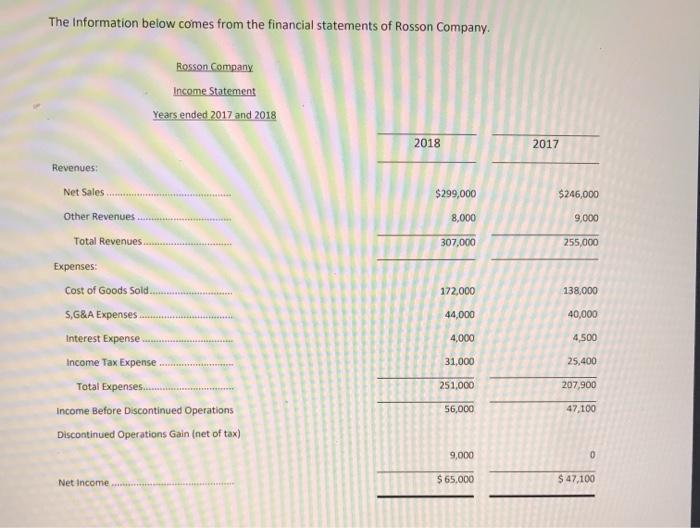
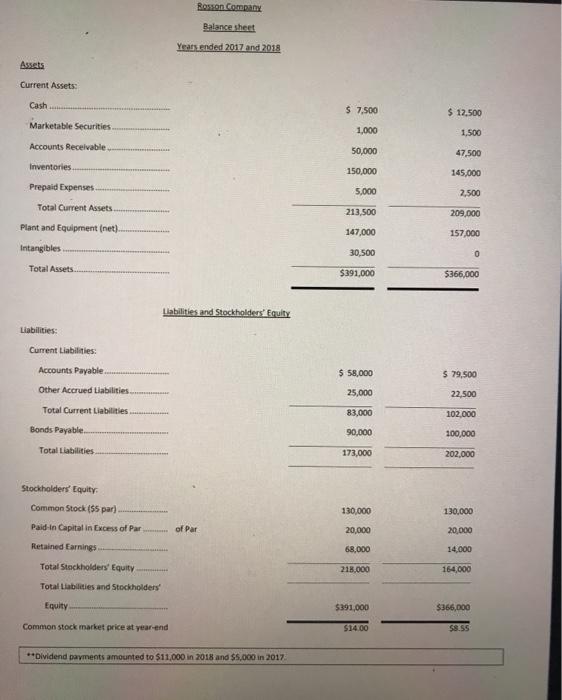
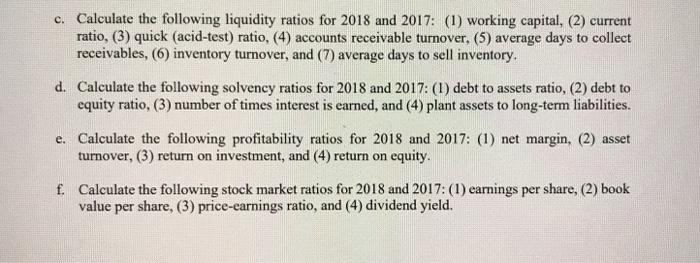
c E F G A B c. Liquidity Ratios 2 3 2018 2017 1111 Working Capital $130,500 $107,000 4 5 6 2018 2017 7 =_to 1 11 - to 1 9 10 2018 2017 11 Il to 1 = ___ to 1 12 13 2018: 2017: 14 15 16 2018 2017 17 11 18 times times 20 (5) Avg. Days to Collect Receivables 2018 21 2017 22 days days 23 24 25 2018 2017 26 II 27 28 29 30 31 32 2018 2017 = days 22 2018 2017 = % = % 2018 2017 35 d. Solvency Ratios 36 37 38 39 40 41 42 43 44 45 46 47 48 discontinued operations gain 49 50 51 2018 2017 times times 2018 2017 = to = 52 1 = __ to 1 53 55 e. Profitability Ratios 56 2018 2017 57 II = % 58 59 60 2018 2017 61 = 11 62 63 64 65 2018 2017 66 67 68 69 70 2018 2017 71 = 72 2018 2017 $ = $ 75 f. Stock Market Ratios 76 77 18 19 30 31 32 33 34 85 26 87 2018 2017 $ = $ 2018 2017 = 38 89 20 31 2 2018 2017 8 9 = % = % The Information below comes from the financial statements of Rosson Company. Rosson Company Income Statement Years ended 2017 and 2018 2018 2017 Revenues: Net Sales $299,000 $246,000 Other Revenues 8,000 9,000 307,000 255,000 172,000 138,000 44,000 40,000 Total Revenues Expenses: Cost of Goods Sold S,G&A Expenses Interest Expense Income Tax Expense Total Expenses. Income Before Discontinued Operations Discontinued Operations Gain (net of tax) 4,000 4,500 31,000 25,400 251,000 207,900 56,000 47.100 9,000 0 Net Income $ 65,000 $ 47,100 Rosson Company Balance sheet Year ended 2017 and 2018 Assets Current Assets: Cash $ 7,500 $ 12,500 Marketable Securities 1,000 1.500 Accounts Receivable 50,000 47,500 Inventories 150,000 145,000 5,000 2,500 Prepaid Expenses Total Current Assets Plant and Equipment (net) 213,500 209,000 147,000 157.000 Intangibles 30,500 0 Total Assets $391,000 5366,000 Liabilities and Stockholders' Equity Liabilities: $ 58,000 579,500 Current Liabilities: Accounts Payable Other Accrued Liabilities... Total Current Liabilities Bonds Payable 25,000 22,500 83,000 102,000 90,000 100,000 Total Liabilities 173,000 202.000 130,000 130,000 Stockholders' Equity Common Stock (par) Paid-in Capital in Excess of Par Retained Earnings of Par 20,000 20,000 68,000 14,000 Total Stockholders' Equity 218.000 164,000 Total Liabilities and Stockholders' Equity $391,000 $366,000 Common stock market price at year-end 514.00 $8.55 **Dividend payments amounted to $11,000 in 2018 and $5,000 in 2017 c. Calculate the following liquidity ratios for 2018 and 2017: (1) working capital, (2) current ratio, (3) quick (acid-test) ratio, (4) accounts receivable turnover. (5) average days to collect receivables, (6) inventory turnover, and (7) average days to sell inventory. d. Calculate the following solvency ratios for 2018 and 2017: (1) debt to assets ratio, (2) debt to equity ratio, (3) number of times interest is earned, and (4) plant assets to long-term liabilities. e. Calculate the following profitability ratios for 2018 and 2017: (1) net margin, (2) asset turnover, (3) return on investment, and (4) return on equity. f. Calculate the following stock market ratios for 2018 and 2017: (1) earnings per share, (2) book value per share, (3) price-earnings ratio, and (4) dividend yield
Step by Step Solution
There are 3 Steps involved in it

Get step-by-step solutions from verified subject matter experts