

Question: Please use this data to create a line graph on excel. The X Axis label should be: Total Weight Change (g) The Y Axis label
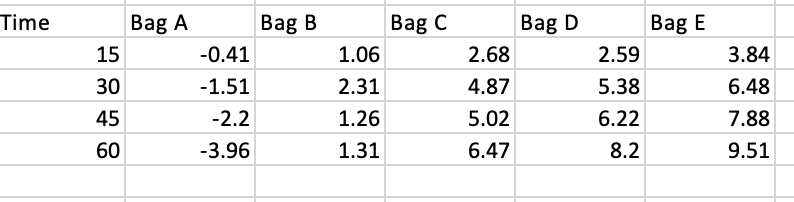
Please use this data to create a line graph on excel.
The X Axis label should be: Total Weight Change (g)
The Y Axis label should be : Time (Minutes)
The Title of the Graph should be Total Weight Change of Dialysis Bags vs Time
Step by Step Solution
There are 3 Steps involved in it
1 Expert Approved Answer
Step: 1 Unlock

Question Has Been Solved by an Expert!
Get step-by-step solutions from verified subject matter experts
Step: 2 Unlock
Step: 3 Unlock