

Question: Please verify these are correct using this data: https://onedrive.live.com/view.aspx?resid=512BC2300C6225B9!278&ithint=file%2cxlsx&authkey=!AIUti931YjN92e0 Agency leadership decides to run a One Proportion hypothesis test to determine if the proportion of
Please verify these are correct using this data: https://onedrive.live.com/view.aspx?resid=512BC2300C6225B9!278&ithint=file%2cxlsx&authkey=!AIUti931YjN92e0
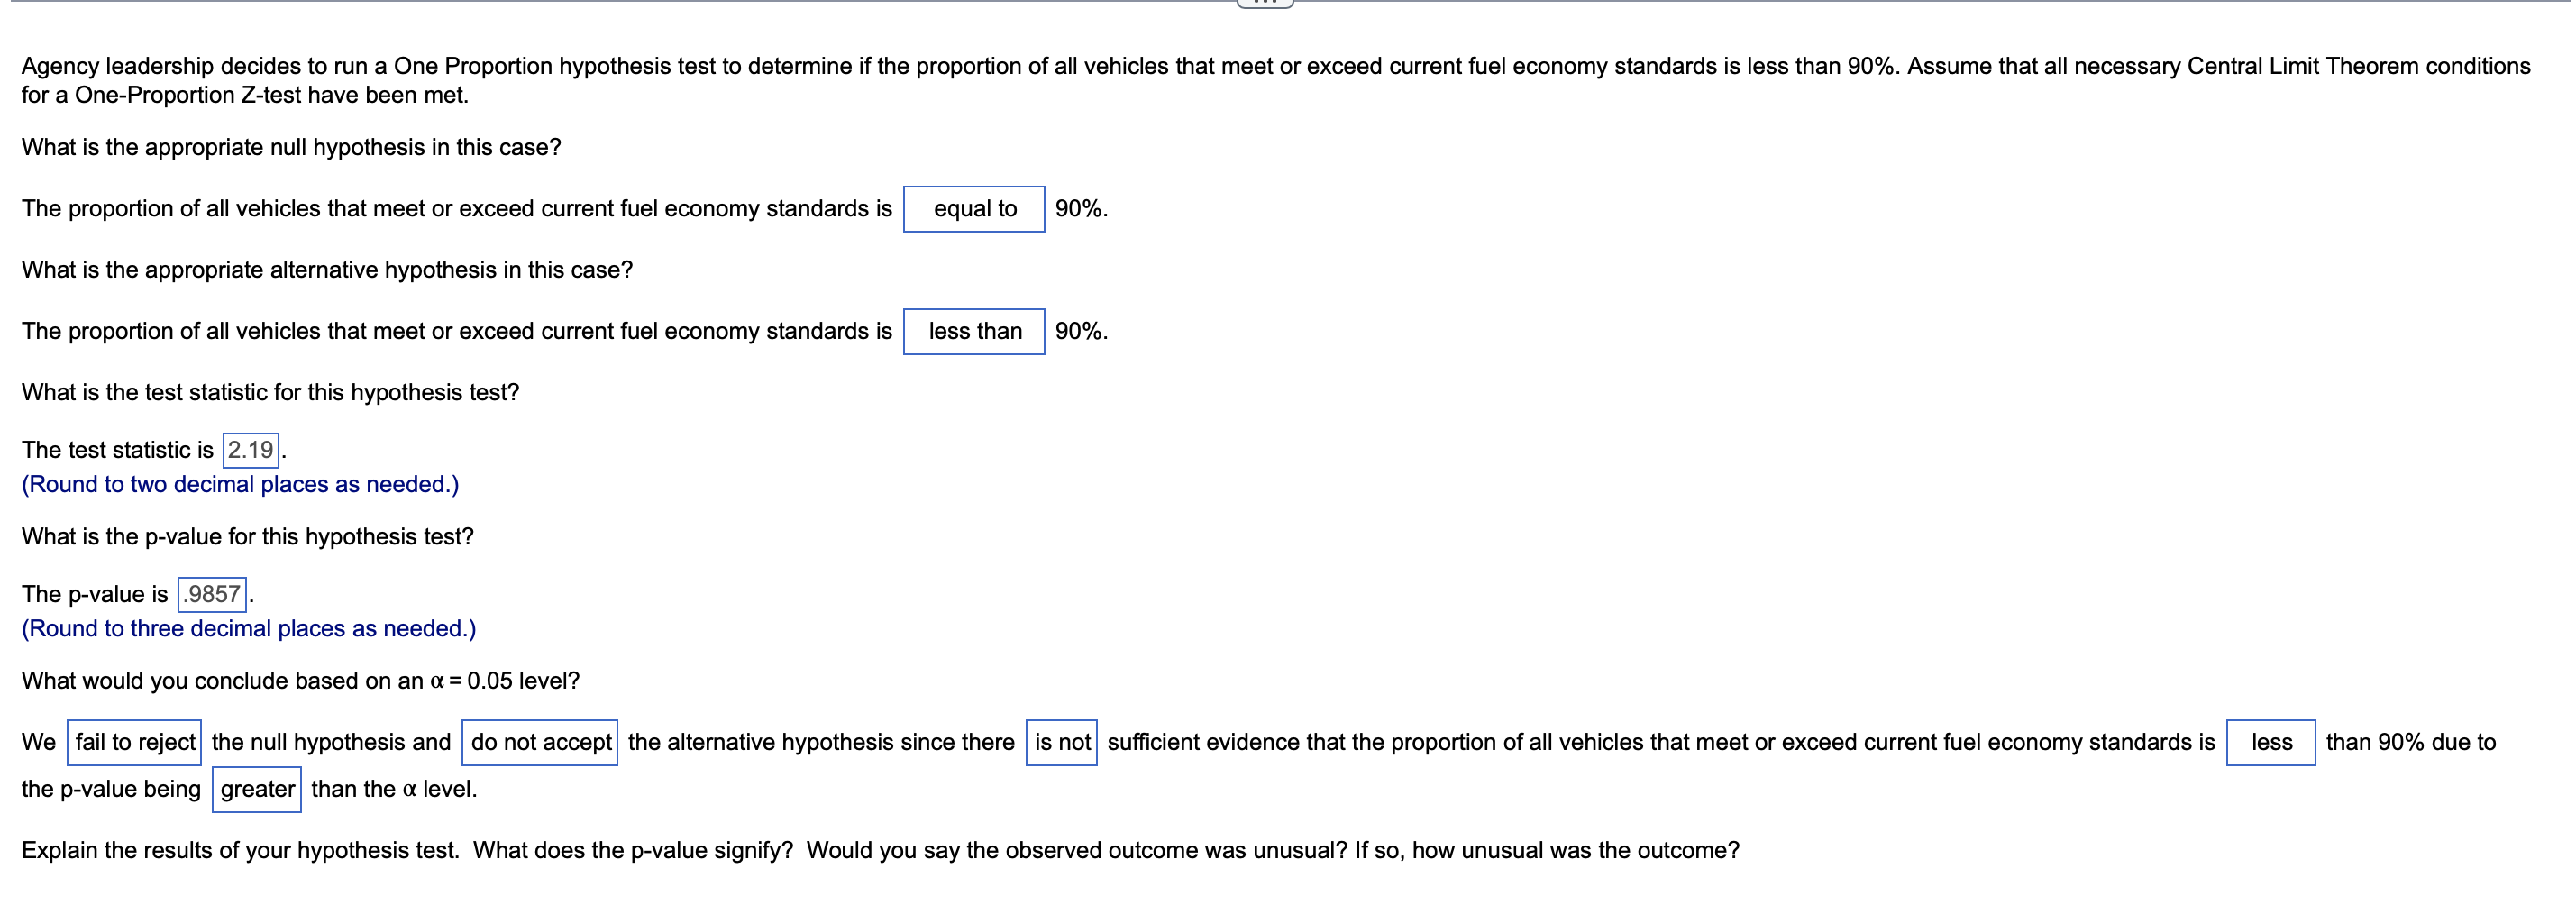
Agency leadership decides to run a One Proportion hypothesis test to determine if the proportion of all vehicles that meet or exceed current fuel economy standards is less than 90%. Assume that all necessary Central Limit Theorem conditions for a One-Proportion Z-test have been met. What is the appropriate null hypothesis in this case? The proportion of all vehicles that meet or exceed current fuel economy standards is equal to 90%. What is the appropriate alternative hypothesis in this case? The proportion of all vehicles that meet or exceed current fuel economy standards is less than 90%. What is the test statistic for this hypothesis test? The test statistic is 2.19 . (Round to two decimal places as needed.) What is the pvalue for this hypothesis test'! The p-value is .9857 . (Round to three decimal places as needed.) What would you conclude based on an a = 0.05 level? We fail to reject the null hypothesis and do not accept the altemative hypothesis since there is not sufcient evidence that the proportion of all vehicles that meet or exceed current fuel economy standards is less than 90% due to the pvalue being greater than the a level. Explain the results of your hypothesis test. What does the p-value signify? Would you say the observed outcome was unusual? If so, how unusual was the outcome
Step by Step Solution
There are 3 Steps involved in it

Get step-by-step solutions from verified subject matter experts