

Question: please write code in matlab EE 386, Spring 2020 MATLAB / Simulink Assignment 1 Due: 01/29/20 For this assignment, you should turn in a paper
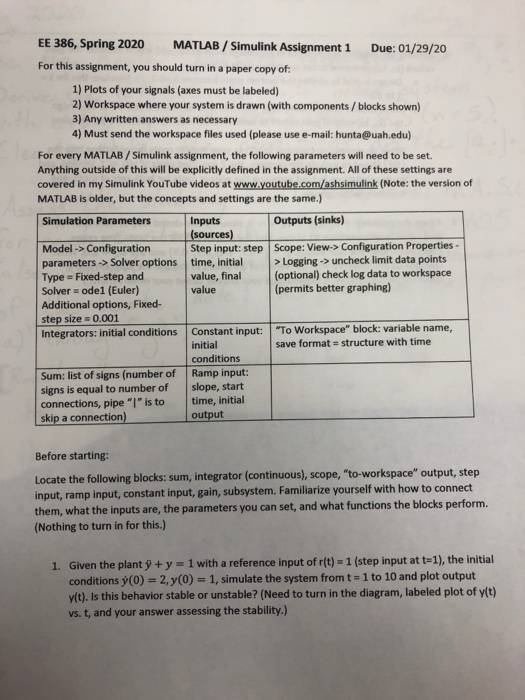
EE 386, Spring 2020 MATLAB / Simulink Assignment 1 Due: 01/29/20 For this assignment, you should turn in a paper copy of: 1) Plots of your signals (axes must be labeled) 2) Workspace where your system is drawn (with components / blocks shown) 3) Any written answers as necessary 4) Must send the workspace files used (please use e-mail: hunta@uah.edu) For every MATLAB / Simulink assignment, the following parameters will need to be set. Anything outside of this will be explicitly defined in the assignment. All of these settings are covered in my Simulink YouTube videos at www.youtube.com/ashsimulink (Note: the version of MATLAB is older, but the concepts and settings are the same.) Outputs (sinks) Simulation Parameters Inputs (sources) Step input: step time, initial value, final value Scope: View-> Configuration Properties - > Logging -> uncheck limit data points (optional) check log data to workspace (permits better graphing) Model -> Configuration parameters -> Solver options Type = Fixed-step and Solver = odel (Euler) Additional options, Fixed- step size = 0.001 Integrators: initial conditions Constant input: "To Workspace" block: variable name, save format = structure with time initial conditions Sum: list of signs (number of signs is equal to number of connections, pipe "|" is to skip a connection) Ramp input: slope, start time, initial output Before starting: Locate the following blocks: sum, integrator (continuous), scope, "to-workspace" output, step input, ramp input, constant input, gain, subsystem. Familiarize yourself with how to connect them, what the inputs are, the parameters you can set, and what functions the blocks perform. (Nothing to turn in for this.) Given the plant + y = 1 with a reference input of r(t) = 1 (step input at t=1), the initial conditions y(0) = 2, y(0) = 1, simulate the system from t = 1 to 10 and plot output y(t). Is this behavior stable or unstable? (Need to turn in the diagram, labeled plot of y(t) vs. t, and your answer assessing the stability.) 1
Step by Step Solution
There are 3 Steps involved in it

Get step-by-step solutions from verified subject matter experts