

Question: Plot #3 using either excel or matlab (19) MS Frequency range: 200 Hz s f s 20 kHz, step size: 200 Hz, x-axis: 200 Hzs
 Plot #3 using either excel or matlab
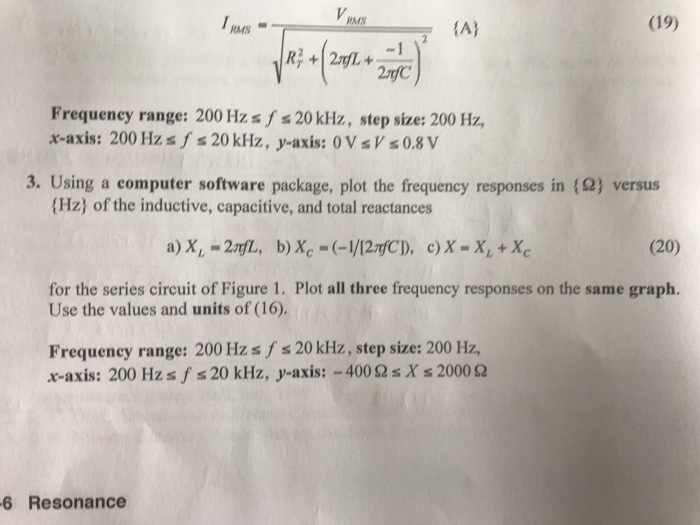
 (19) MS Frequency range: 200 Hz s f s 20 kHz, step size: 200 Hz, x-axis: 200 Hzs f s 20 kHz, y-axis: 0 VsV s0.8 V 3. Using a computer software package, plot the frequency responses in versus (Hz) of the inductive, capacitive, and total reactances (20) for the series circuit of Figure 1. Plot all three frequency responses on the same graph. Use the values and units of (16). Frequency range: 200 Hzs f s 20 kHz, step size: 200 Hz, x-axis: 200 Hzsf 20 kHz, y-axis:-400 sXs 2000 6 Resonance (19) MS Frequency range: 200 Hz s f s 20 kHz, step size: 200 Hz, x-axis: 200 Hzs f s 20 kHz, y-axis: 0 VsV s0.8 V 3. Using a computer software package, plot the frequency responses in versus (Hz) of the inductive, capacitive, and total reactances (20) for the series circuit of Figure 1. Plot all three frequency responses on the same graph. Use the values and units of (16). Frequency range: 200 Hzs f s 20 kHz, step size: 200 Hz, x-axis: 200 Hzsf 20 kHz, y-axis:-400 sXs 2000 6 Resonance
Step by Step Solution
There are 3 Steps involved in it

Get step-by-step solutions from verified subject matter experts