

Question: Plot both consumption and savings relationships on one grid with consumption and saving shown on the vertical axis and disposable income on the horizontal axis.
Plot both consumption and savings relationships on one grid with consumption and saving shown on the vertical axis and disposable income on the horizontal axis. Using the property of the 45o line, explain and indicate where savings would be zero.
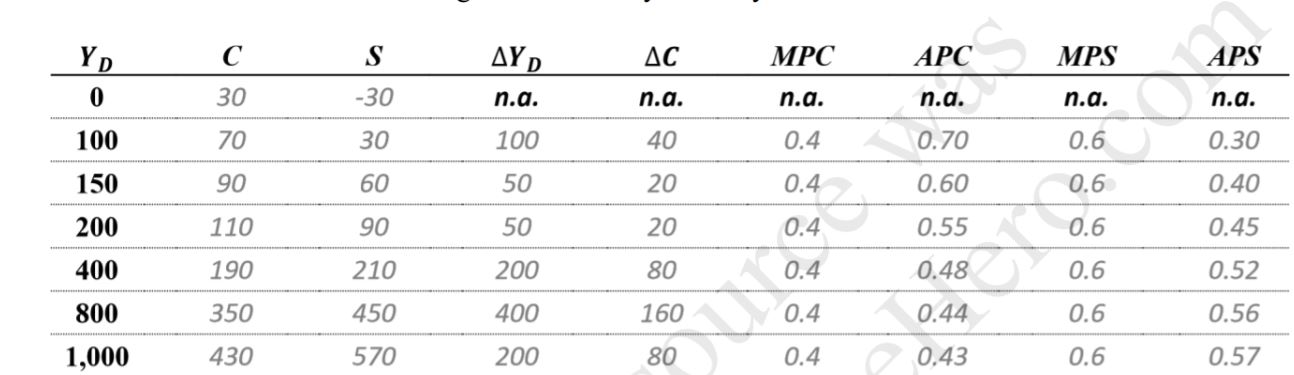
YD C S AY D AC MPC APC MPS APS 0 30 -30 n.a. n.a. n.a. n.a. n.a. n.a. 100 70 30 100 40 0.4 0.70 0.6 0.30 150 90 60 50 20 0.4 0.60 0.6 0.40 200 110 90 50 20 0.4 0.55 0.6 0.45 400 190 210 200 80 0.4 0.48 0.6 0.52 800 350 450 400 160 0.4 0.44 0.6 0.56 1,000 430 570 200 80 0.4 0,43 0.6 0.57
Step by Step Solution
There are 3 Steps involved in it
1 Expert Approved Answer
Step: 1 Unlock

Question Has Been Solved by an Expert!
Get step-by-step solutions from verified subject matter experts
Step: 2 Unlock
Step: 3 Unlock