

Question: Plot each of the following functions using Octave. For each plot use a window size of min -2, xmax = 2, provide a title
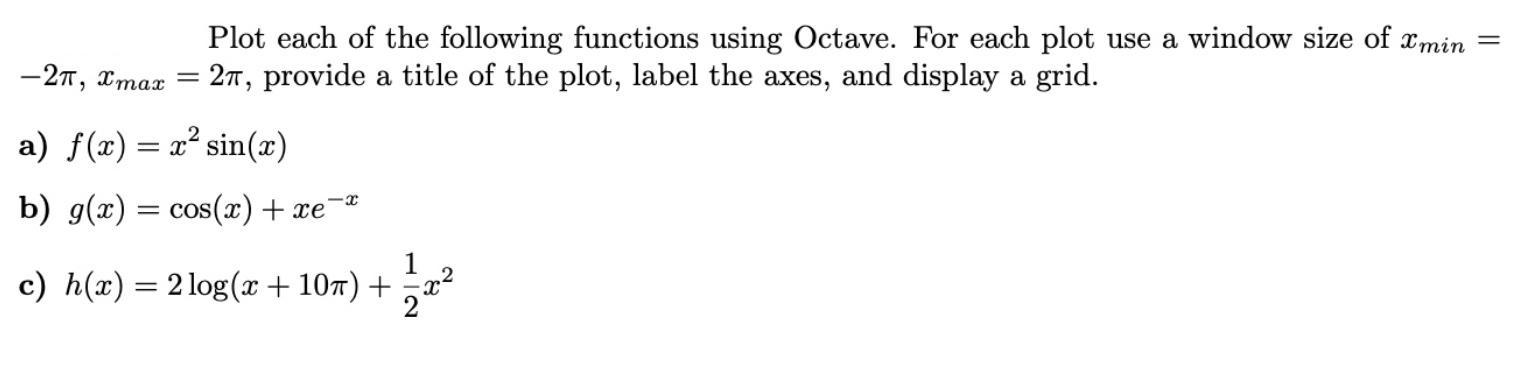
Plot each of the following functions using Octave. For each plot use a window size of min -2, xmax = 2, provide a title of the plot, label the axes, and display a grid. a) f(x) = x sin(x) -X b) g(x) = cos(x) + xe c) h(x) = 2log(x + 10) +
Step by Step Solution
★★★★★
3.42 Rating (146 Votes )
There are 3 Steps involved in it
1 Expert Approved Answer
Step: 1 Unlock

Solu... View full answer
Question Has Been Solved by an Expert!
Get step-by-step solutions from verified subject matter experts
Step: 2 Unlock
Step: 3 Unlock