

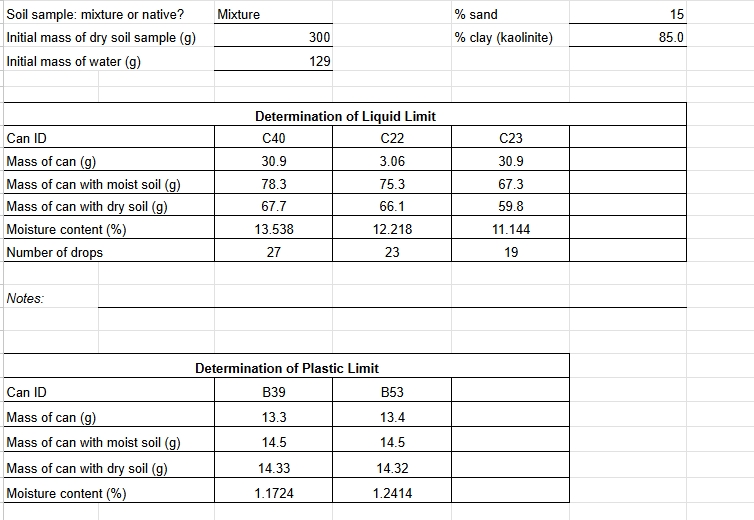
Question: Plot moisture contents from the liquid limit test on one semi - logarithmic chart ( x - axis = number of drops + logarithmic scale
Plot moisture contents from the liquid limit test on one semilogarithmic chart xaxis
number of drops logarithmic scale and yaxis moisture content arithmetic scale
for all five groups. For each soil, fit the best line through the data points five flow curves
in total Evaluate the liquid limit value report it as a whole number without the sign
for each groups soil. Include the clay and sand eg clay sand in the
legend for soils used by Groups through and native for soil used by Group For the
soils used by Groups through develop one plot with the liquid limit yaxis versus the
percent of clay xaxis
Calculate the plastic limit value report it as a whole number without the sign for each
groups soil five plastic limit values in total For the soils used by Groups through
show the plastic limit yaxis versus the percent of clay xaxis on one plot.
Calculate the plasticity index report it as a whole number without the sign for each
groups soil. For the soils used by Groups through develop one plot with the plasticity
index yaxis versus the percent of clay xaxis
Classify each groups soil per USCS. For the soil tested by Group the additional data
needed for the classification can be found in your Lab spreadsheetreport
Based on the results for the soils of Groups through how does the increase in clay
content affect the plastic limit liquid limit and plasticity index? Explain.
Do the results and observed trends agree with your expectations? Explain.
just for this group data
Step by Step Solution
There are 3 Steps involved in it
1 Expert Approved Answer
Step: 1 Unlock

Question Has Been Solved by an Expert!
Get step-by-step solutions from verified subject matter experts
Step: 2 Unlock
Step: 3 Unlock