

Question: Plot the NPV profile in Excel for each project in Example 7.1. 2. For each project, describe the cash flows and elaborate why or why
- Plot the NPV profile in Excel for each project in Example 7.1.
2. For each project, describe the cash flows and elaborate why or why not the IRR rule provides the correct decision.
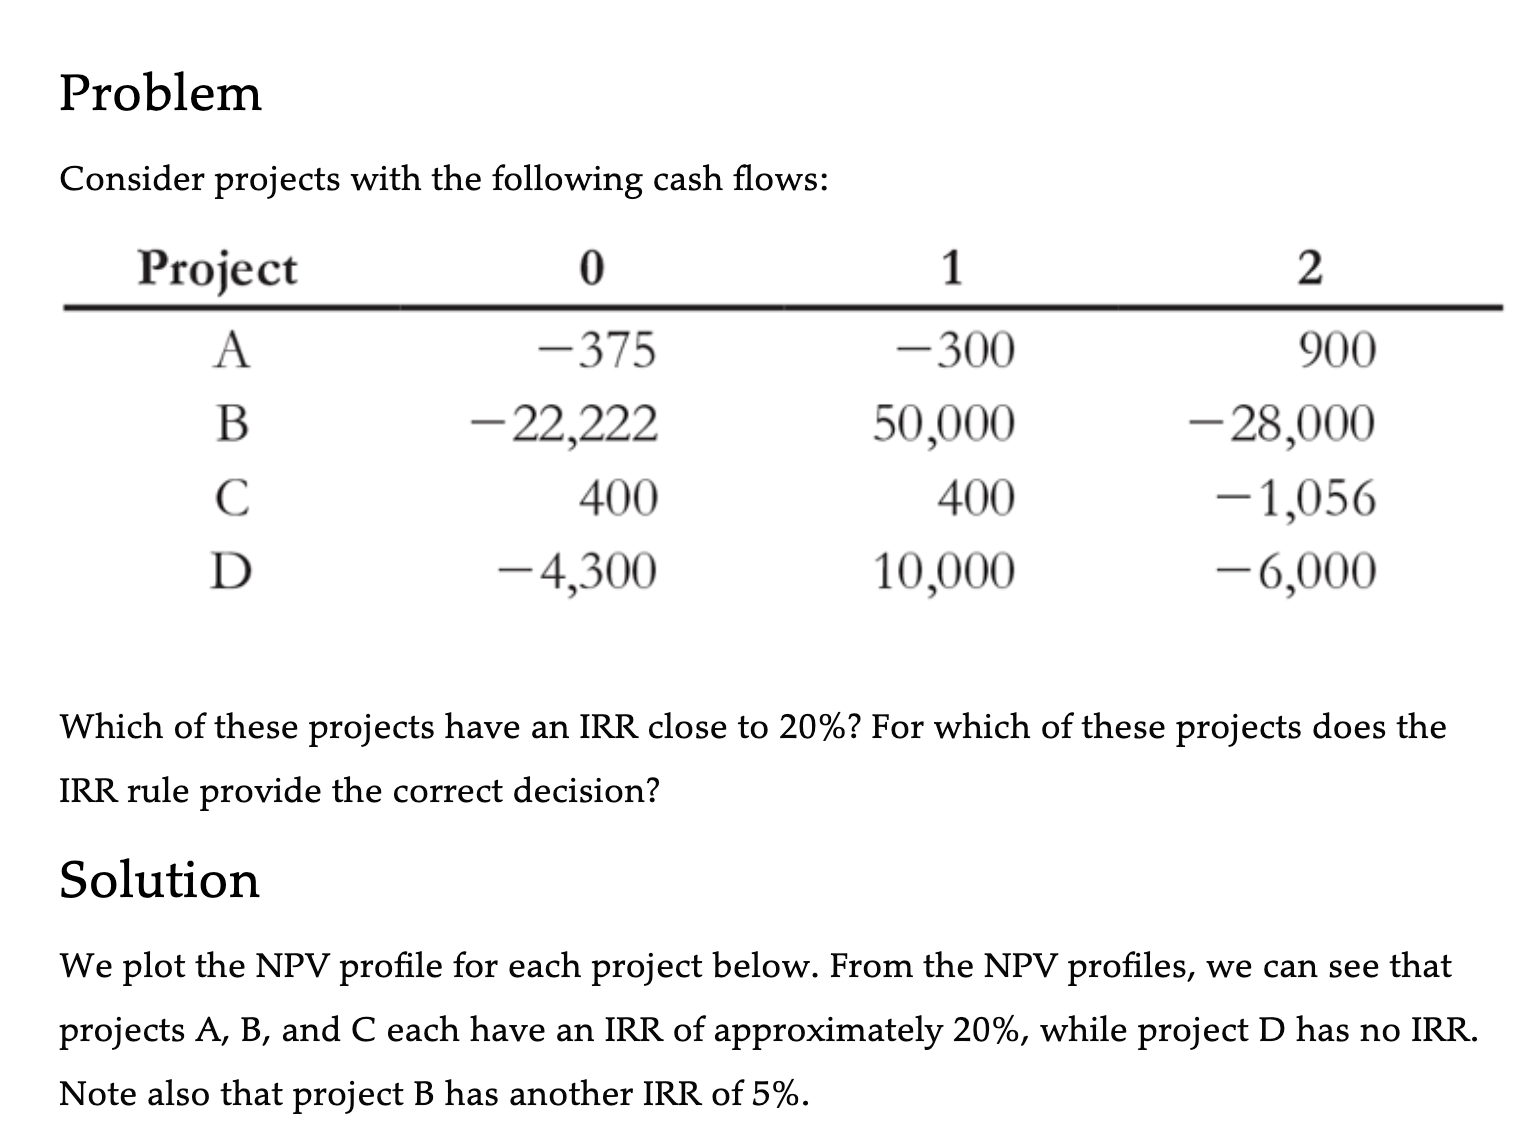
Consider projects with the following cash flows: Which of these projects have an IRR close to 20% ? For which of these projects does the IRR rule provide the correct decision? Solution We plot the NPV profile for each project below. From the NPV profiles, we can see that projects A, B, and C each have an IRR of approximately 20%, while project D has no IRR. Note also that project B has another IRR of 5%
Step by Step Solution
There are 3 Steps involved in it
1 Expert Approved Answer
Step: 1 Unlock

Question Has Been Solved by an Expert!
Get step-by-step solutions from verified subject matter experts
Step: 2 Unlock
Step: 3 Unlock