

Question: Plot the Risk Sensitivity profile for the following two deals. Hint: The Risk-Sensitivity profile is a plot of the certain equivalent of a deal
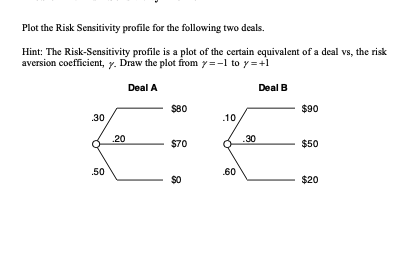
Plot the Risk Sensitivity profile for the following two deals. Hint: The Risk-Sensitivity profile is a plot of the certain equivalent of a deal vs, the risk aversion coefficient, y. Draw the plot from y=-1 to y=+1 Deal A Deal B $80 $90 .30 .10 20 .30 $70 $50 .50 .60 $20
Step by Step Solution
There are 3 Steps involved in it
1 Expert Approved Answer
Step: 1 Unlock

Question Has Been Solved by an Expert!
Get step-by-step solutions from verified subject matter experts
Step: 2 Unlock
Step: 3 Unlock