

Question: Plot the root loci with MATLAB B-6-17. Consider the closed-loop system with transport lag shown in Figure 6-66. Determine the stability range for gain K.
Plot the root loci with MATLAB 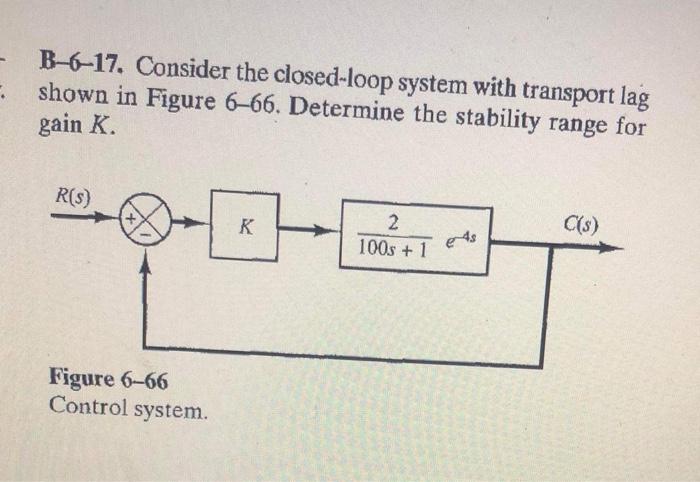
B-6-17. Consider the closed-loop system with transport lag shown in Figure 6-66. Determine the stability range for gain K. R(S) K 2 100s + 1 C(s) ets Figure 6-66 Control system
Step by Step Solution
There are 3 Steps involved in it
1 Expert Approved Answer
Step: 1 Unlock

Question Has Been Solved by an Expert!
Get step-by-step solutions from verified subject matter experts
Step: 2 Unlock
Step: 3 Unlock