

Question: Plot the time domain plots for the results of approximation of gp ( t ) for 5 cases respectively for the time duration ( -
Plot the time domain plots for the results of approximation of gp t for cases
respectively for the time duration sec to sec
Cases: Summed up to harmonics, harmonics, harmonics, harmonics, and
harmonics.
Compare with the plot of original g p t for each case above. Then Discuss on the
Accuracy of approximations per the cases of more harmonics added up It can
include discussion and comparison of peak magnitude, time spread or shifting,
overall shape of the plots, etc.
Using the coefficients you found up to harmonics, calculate the total average
power normalized to ohm load per respective cases. Then compare and discuss
on the difference.
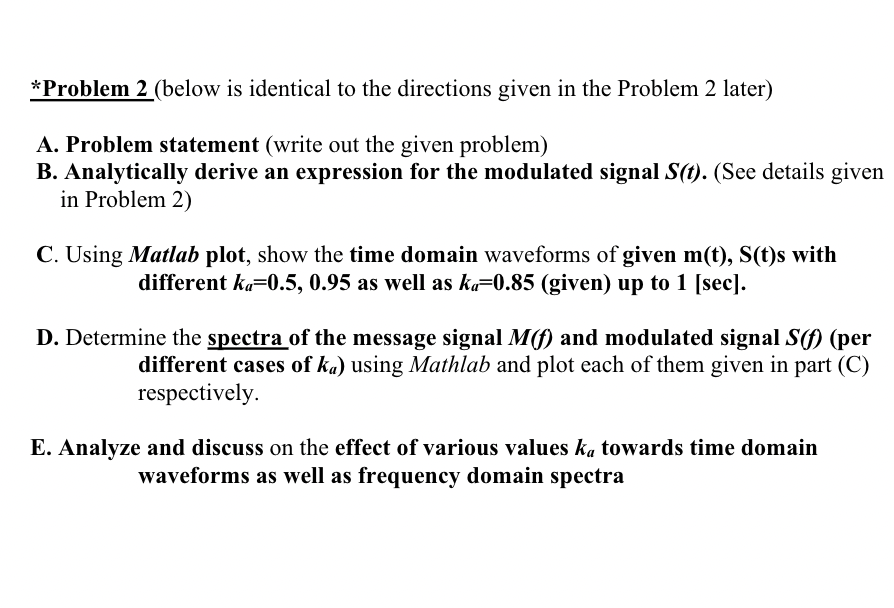
Problem below is identical to the directions given in the Problem later
A Problem statement write out the given problem
B Analytically derive an expression for the modulated signal StSee details given
in Problem
C Using Matlab plot, show the time domain waveforms of given mtSts with
different ka as well as kagiven up to sec
D Determine the spectra of the message signal Mf and modulated signal Sfka ka towards time domain
waveforms as well as frequency domain spectra
Step by Step Solution
There are 3 Steps involved in it
1 Expert Approved Answer
Step: 1 Unlock

Question Has Been Solved by an Expert!
Get step-by-step solutions from verified subject matter experts
Step: 2 Unlock
Step: 3 Unlock