

Question: Plot the Trajectory of Projectile from launch until the projectile reaches y = 0 m in MATLAB Assignm Part 23 Part 23 Use your Initial
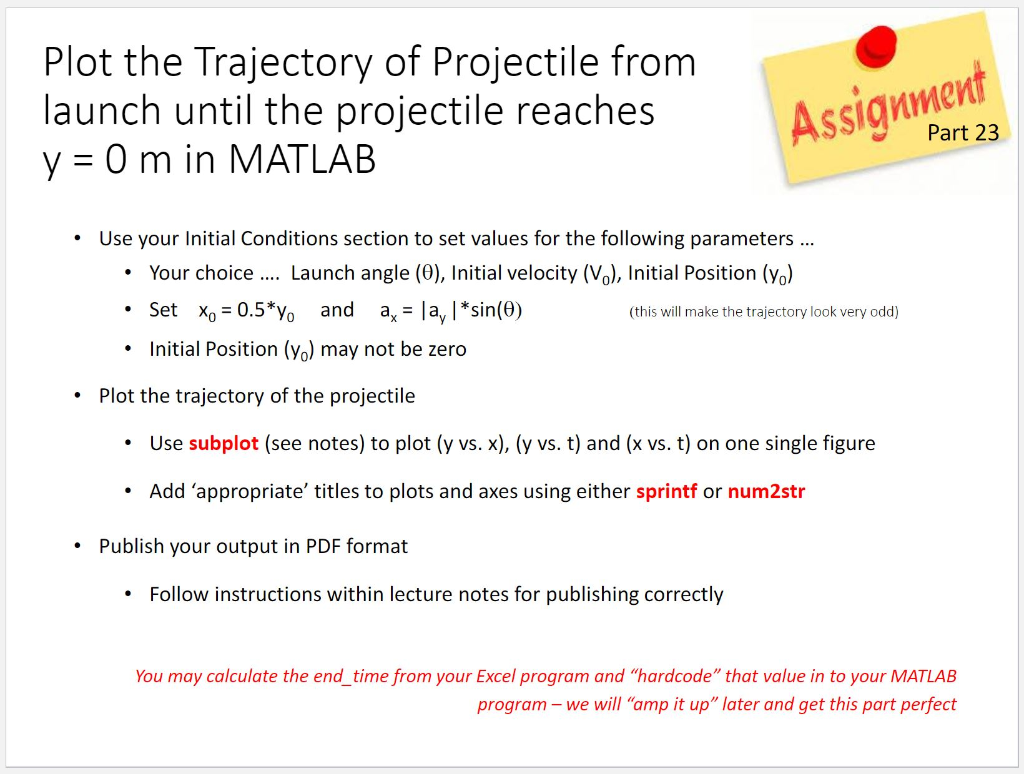
Plot the Trajectory of Projectile from launch until the projectile reaches y = 0 m in MATLAB Assignm Part 23 Part 23 Use your Initial Conditions section to set values for the following parameters ... Your choice .... Launch angle (0), Initial velocity (V.), Initial Position (yo) Set Xo = 0.5*y and ax = la, *sin(0) (this will make the trajectory look very odd) Initial Position (yo) may not be zero Plot the trajectory of the projectile Use subplot (see notes) to plot (y vs. x), (y vs. t) and (x vs. t) on one single figure Add 'appropriate' titles to plots and axes using either sprintf or num2str Publish your output in PDF format Follow instructions within lecture notes for publishing correctly You may calculate the end_time from your Excel program and "hardcode" that value in to your MATLAB program - we will "amp it up" later and get this part perfect
Step by Step Solution
There are 3 Steps involved in it

Get step-by-step solutions from verified subject matter experts