

Question: (Plot Using matlab, show code.) (30 pts) For of the SDOF system shown below excited by the pavement profile from problem a. Find and plot
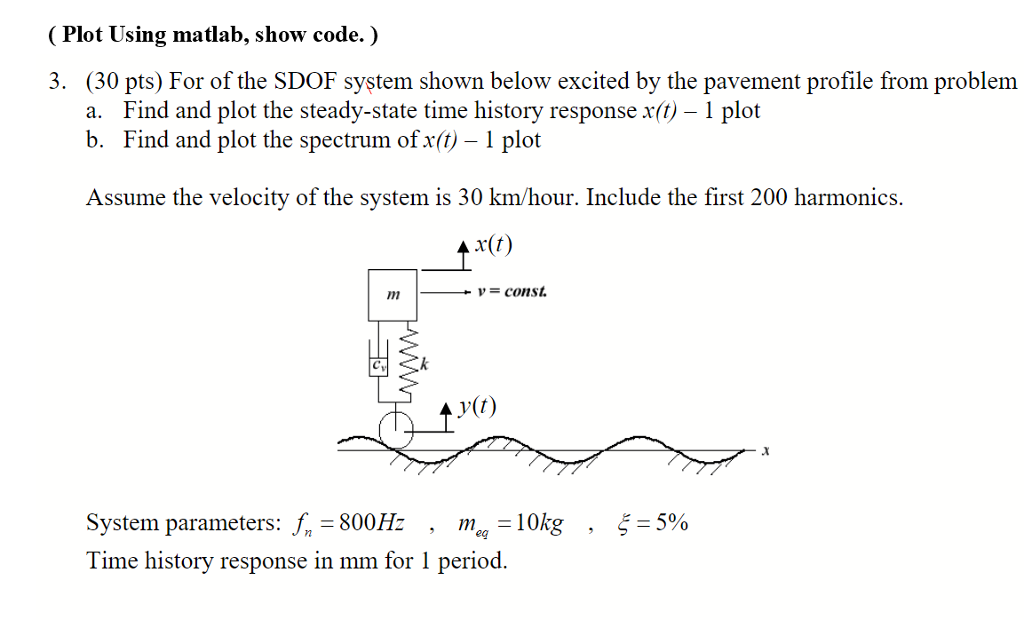
(Plot Using matlab, show code.) (30 pts) For of the SDOF system shown below excited by the pavement profile from problem a. Find and plot the steady-state time history response x(t)-1 plot b. Find and plot the spectrum of x(t) - 1 plot 3. Assume the velocity of the system is 30 km/hour. Include the first 200 harmonics r(t) 4y(i) System parameters:.: 80011: , m,-10kg Time history response in mm for 1 period 5-5% , (Plot Using matlab, show code.) (30 pts) For of the SDOF system shown below excited by the pavement profile from problem a. Find and plot the steady-state time history response x(t)-1 plot b. Find and plot the spectrum of x(t) - 1 plot 3. Assume the velocity of the system is 30 km/hour. Include the first 200 harmonics r(t) 4y(i) System parameters:.: 80011: , m,-10kg Time history response in mm for 1 period 5-5%
Step by Step Solution
There are 3 Steps involved in it

Get step-by-step solutions from verified subject matter experts