

Question: plotting using MATLAB Q2. Determine and plot the frequency response function Hew) (magnitude and phase normalized in w). Choose n = [-20, 20). 1. h(n)
plotting using MATLAB
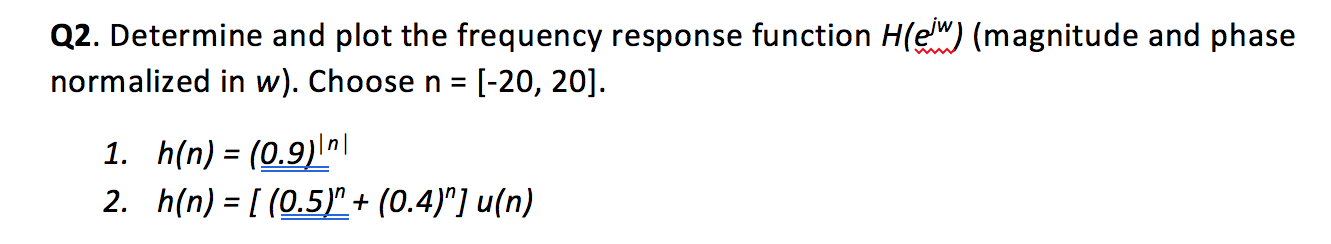
Q2. Determine and plot the frequency response function Hew) (magnitude and phase normalized in w). Choose n = [-20, 20). 1. h(n) = (0.9)11 | 2. h(n) = [(0.5) + (0.4)"] u(n)
Step by Step Solution
There are 3 Steps involved in it
1 Expert Approved Answer
Step: 1 Unlock

Question Has Been Solved by an Expert!
Get step-by-step solutions from verified subject matter experts
Step: 2 Unlock
Step: 3 Unlock