

Question: pls need help with code and explanation use linux ubuntu and pls give output 1 Preamble In practicals you have implemented and learned about simulations,
pls need help with code and explanation use linux ubuntu and pls give output
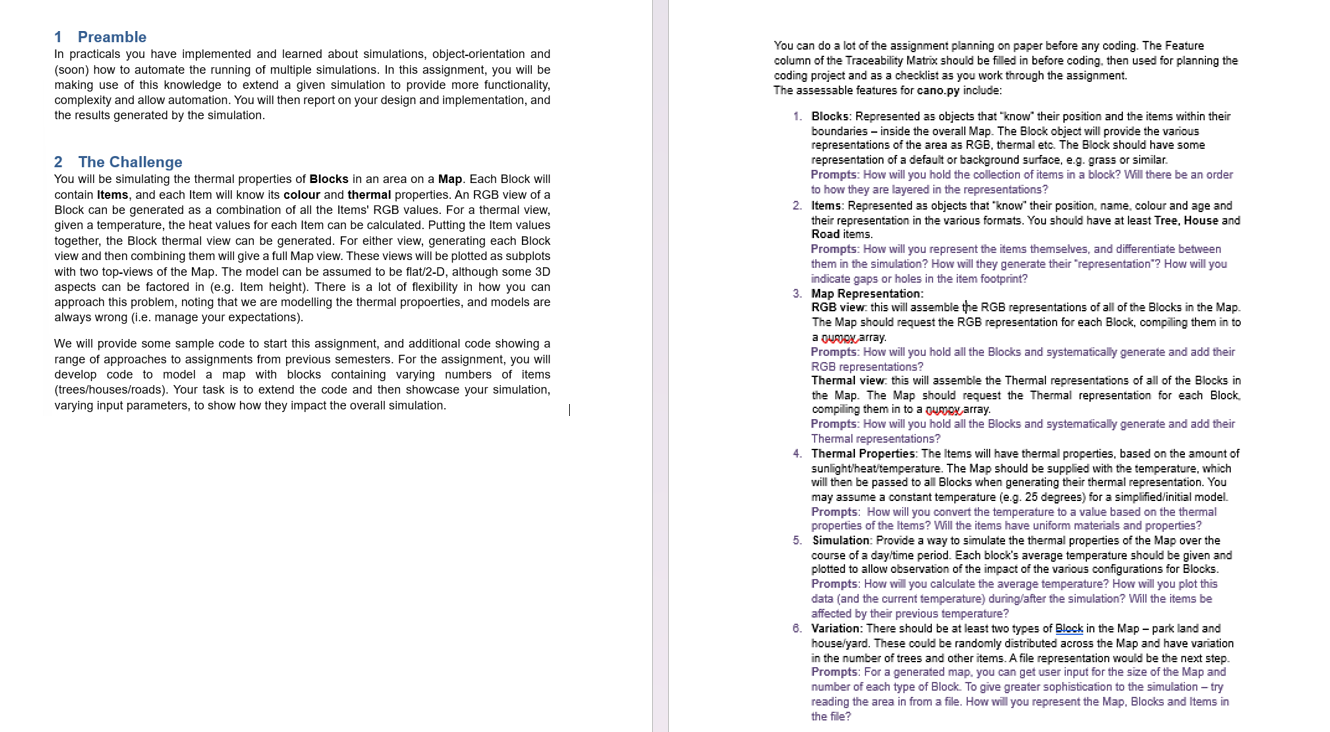
Preamble
In practicals you have implemented and learned about simulations, objectorientation and
soon how to automate the running of multiple simulations. In this assignment, you will be
making use of this knowledge to extend a given simulation to provide more functionality,
complexity and allow automation. You will then report on your design and implementation, and
the results generated by the simulation.
The Challenge
You will be simulating the thermal properties of Blocks in an area on a Map. Each Block will
contain Items, and each Item will know its colour and thermal properties. An RGB view of a
Block can be generated as a combination of all the Items' RGB values. For a thermal view,
given a temperature, the heat values for each Item can be calculated. Putting the Item values
together, the Block thermal view can be generated. For either view, generating each Block
view and then combining them will give a full Map view. These views will be plotted as subplots
with two topviews of the Map. The model can be assumed to be flatD although some D
aspects can be factored in eg Item height There is a lot of flexibility in how you can
approach this problem, noting that we are modelling the thermal propoerties, and models are
always wrong ie manage your expectations
We will provide some sample code to start this assignment, and additional code showing a
range of approaches to assignments from previous semesters. For the assignment, you will
develop code to model a map with blocks containing varying numbers of items
treeshousesroads Your task is to extend the code and then showcase your simulation,
varying input parameters, to show how they impact the overall simulation.
You can do a lot of the assignment planning on paper before any coding. The Feature
column of the Traceability Matrix should be filled in before coding, then used for planning the
coding project and as a checklist as you work through the assignment.
The assessable features for
cano.py include:
Blocks: Represented as objects that "know' their position and the items within their
boundaries inside the overall Map. The Block object will provide the various
representations of the area as RGB thermal etc. The Block should have some
representation of a default or background surface, eg grass or similar.
Prompts: How will you hold the collection of items in a block? Will there be an order
to how they are layered in the representations?
Items: Represented as objects that 'know' their position, name, colour and age and
their representation in the various formats. You should have at least Tree. House and
Road items.
Prompts: How will you represent the items themselves, and differentiate between
them in the simulation? How will they generate their "representation"? How will you
indicate gaps or holes in the item footprint?
Map Representation:
RGB view this will assemble the RGB representations of all of the Blocks in the Map.
The Map should request the RGB representation for each Block, oompiling them in to
a oupgexarray.
Prompts: How will you hold all the Blocks and systematically generate and add their
RGB representations?
Thermal view. this will assemble the Thermal representations of all of the Blocks in
the Map. The Map should request the Thermal representation for each Block,
compiling them in to a oupes array.
Prompts: How will you hold all the Blocks and systematically generate and add their
Thermal representations?
Thermal Properties: The Items will have thermal properties, based on the amount of
sunlightheattemperature The Map should be supplied with the temperature, which
will then be passed to all Blocks when generating their thermal representation. You
may assume a constant temperature eg degrees for a simplifiedinitial model.
Prompts: How will you convert the temperature to a value based on the thermal
properties of the Items? Will the items have uniform materials and properties?
Simulation: Provide a way to simulate the thermal properties of the Map over the
course of a day'time period. Each block's average temperature should be given and
plotted to allow observation of the impact of the various configurations for Blocks.
Prompts: How will you calculate the average temperature? How will you plot this
data and the current temperature duringafter the simulation? Will the items be
affected by their previous temperature?
Variation: There should be at least two types of Block in the Map park land and
houseyard These could be randomly distributed across the Map and have variation
in the number of trees and other items. A file representation would be the next step.
Prompts: For a generated map. you can get user input for the size of the Map and
number of each type of Block. To give greater sophistication to the simulation try
reading the area in from a file. How will you represent the Map, Blocks and Items in
the file?
Step by Step Solution
There are 3 Steps involved in it
1 Expert Approved Answer
Step: 1 Unlock

Question Has Been Solved by an Expert!
Get step-by-step solutions from verified subject matter experts
Step: 2 Unlock
Step: 3 Unlock