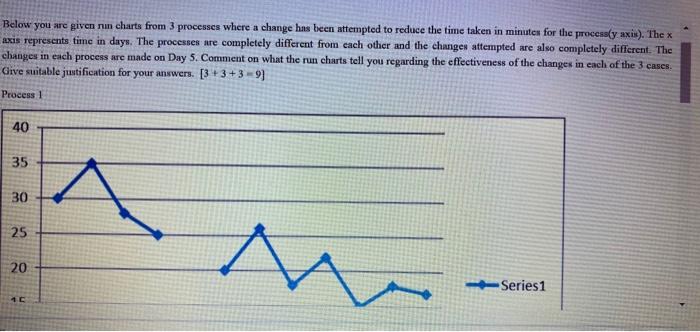
Question: Pls note - The above question is from Total Quality Management discipline. So please have the answer accordingly. Below you are given nun charts from

Pls note - The above question is from Total Quality Management discipline. So please have the answer accordingly.

Pls note - The above question is from Total
Below you are given nun charts from 3 processes where a change has been attempted to reduce the time taken in minutes for the processly axis). The x axis represents time in days. The processes are completely different from each other and the changes attempted are also completely different. The changes in each process are made on Day 5. Comment on what the run charts tell you regarding the effectiveness of the changes in each of the 3 cases. Give suitable justification for your answers. [3+3 +39) Process 1 40 35 30 A 25 20 -Series 1 16 Process 2 50 45 40 35 30 25 Series 1 20 15 10 Process 3 30 25 Wm 20 15 -Series1 10

Step by Step Solution

There are 3 Steps involved in it

1 Expert Approved Answer
Step: 1 Unlock blur-text-image
Question Has Been Solved by an Expert!

Get step-by-step solutions from verified subject matter experts

Step: 2 Unlock
Step: 3 Unlock

Students Have Also Explored These Related General Management Questions!