

Question: PLS ONLY help with problem 18 this is data from problem 9 and 10 . LO2 18. Analyze the data in the following problems using
PLS ONLY help with problem 18 this is data from problem 9 and 10
.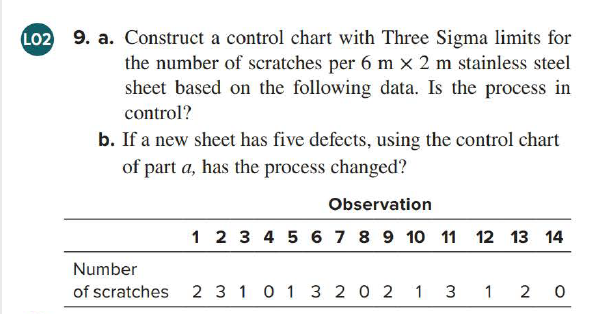
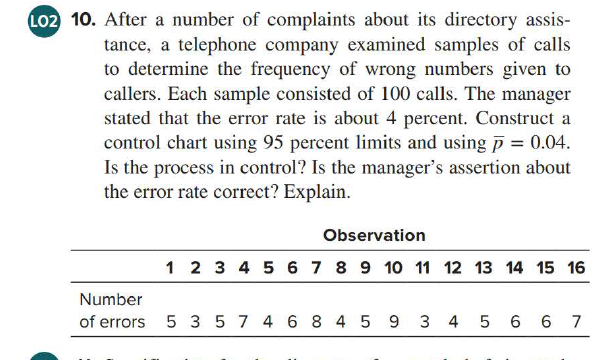
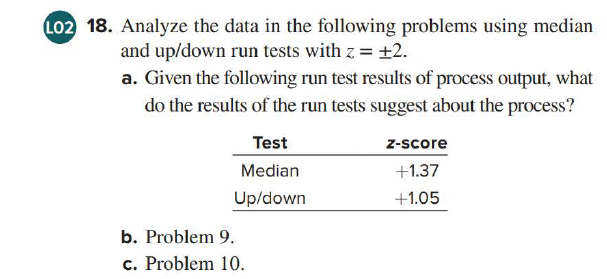
LO2 18. Analyze the data in the following problems using median and up/down run tests with z = +2. a. Given the following run test results of process output, what do the results of the run tests suggest about the process? Test Median Up/down Z-score +1.37 +1.05 b. Problem 9. c. Problem 10. LO2 9. a. Construct a control chart with Three Sigma limits for the number of scratches per 6 m x 2 m stainless steel sheet based on the following data. Is the process in control? b. If a new sheet has five defects, using the control chart of part a, has the process changed? Observation 1 2 3 4 5 6 7 8 9 10 11 12 13 14 Number of scratches 2 3 1 0 1 3 2 0 2 1 3 1 2 0 LO2 10. After a number of complaints about its directory assis- tance, a telephone company examined samples of calls to determine the frequency of wrong numbers given to callers. Each sample consisted of 100 calls. The manager stated that the error rate is about 4 percent. Construct a control chart using 95 percent limits and using 7 = 0.04. Is the process in control? Is the manager's assertion about the error rate correct? Explain. Observation 1 2 3 4 5 6 7 8 9 10 11 12 13 14 15 16 Number of errors 5 3 5 7 4 6 8 4 5 9 3 4 5 6 6 7
Step by Step Solution
There are 3 Steps involved in it
1 Expert Approved Answer
Step: 1 Unlock

Question Has Been Solved by an Expert!
Get step-by-step solutions from verified subject matter experts
Step: 2 Unlock
Step: 3 Unlock