

Question: pls solve do Cut A A 2. Wap Test General M Copy Paste - BIU Merde 8 Center Format Painter 96 Insert Delete Format done
pls solve
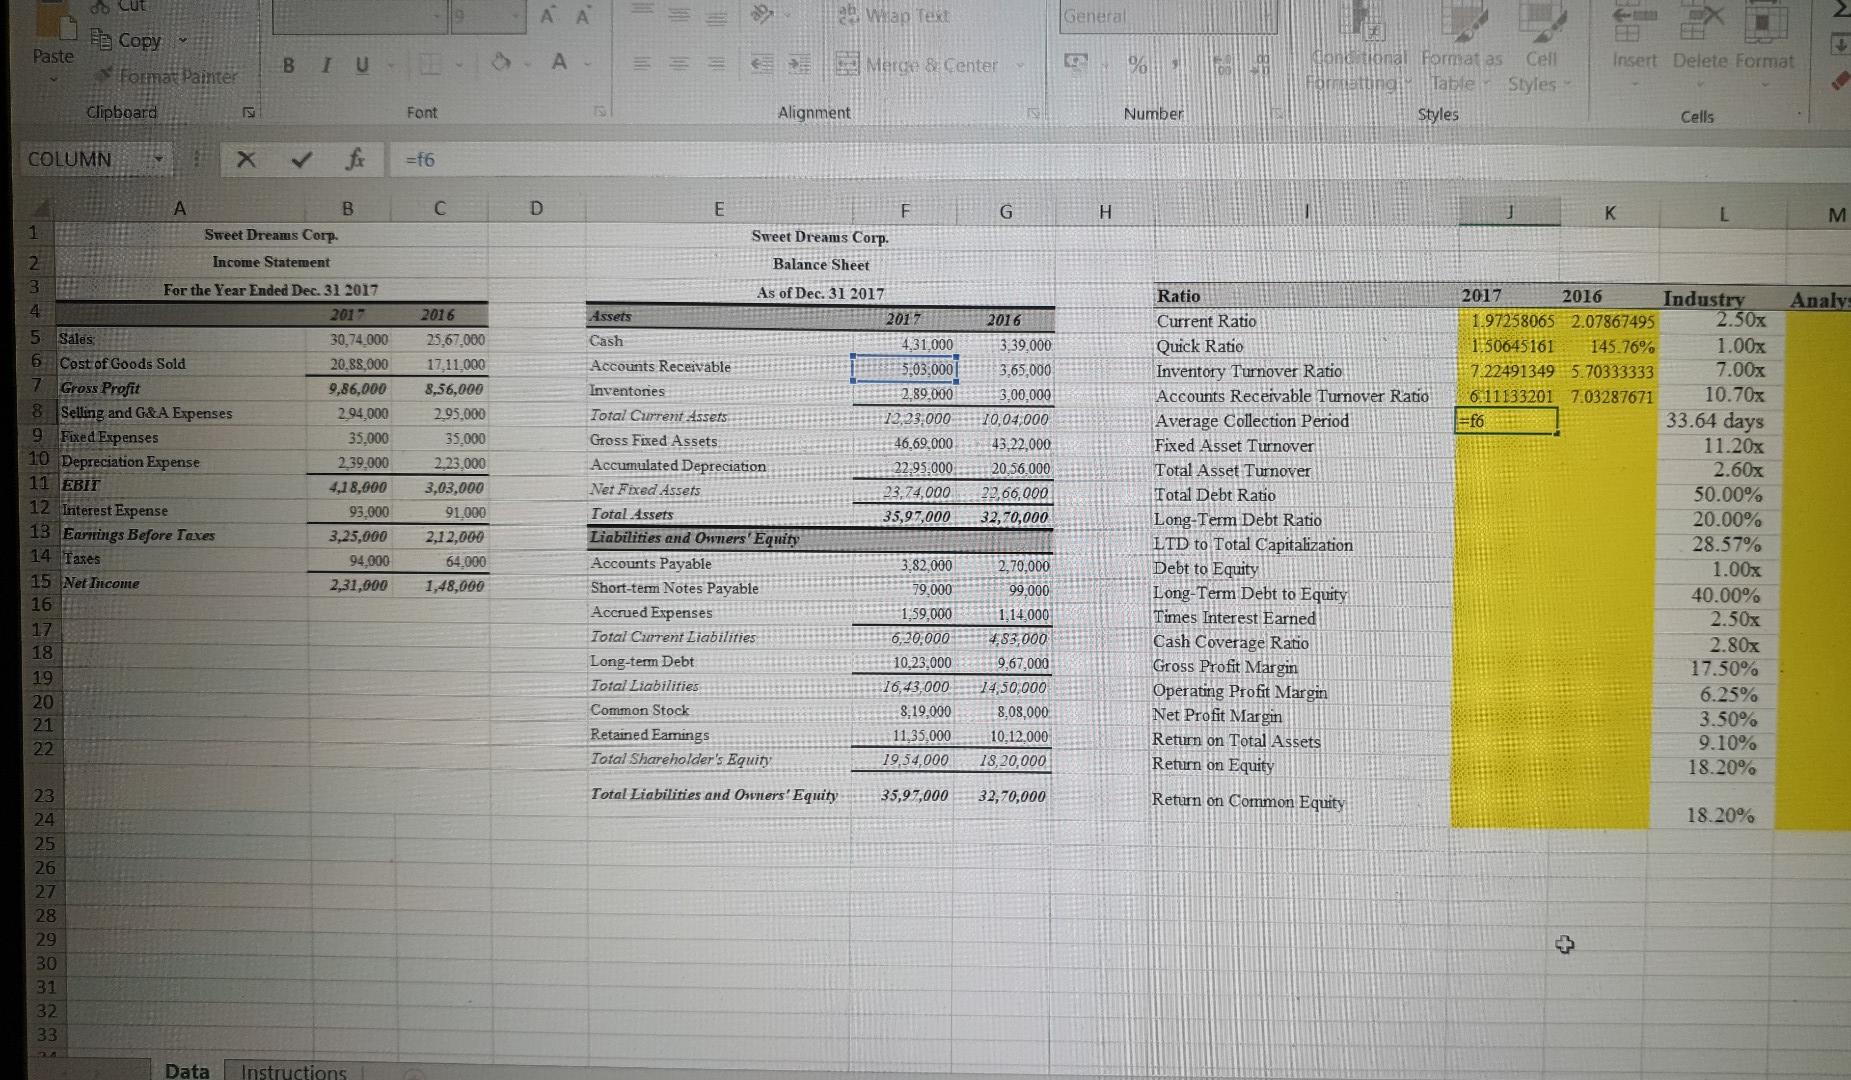
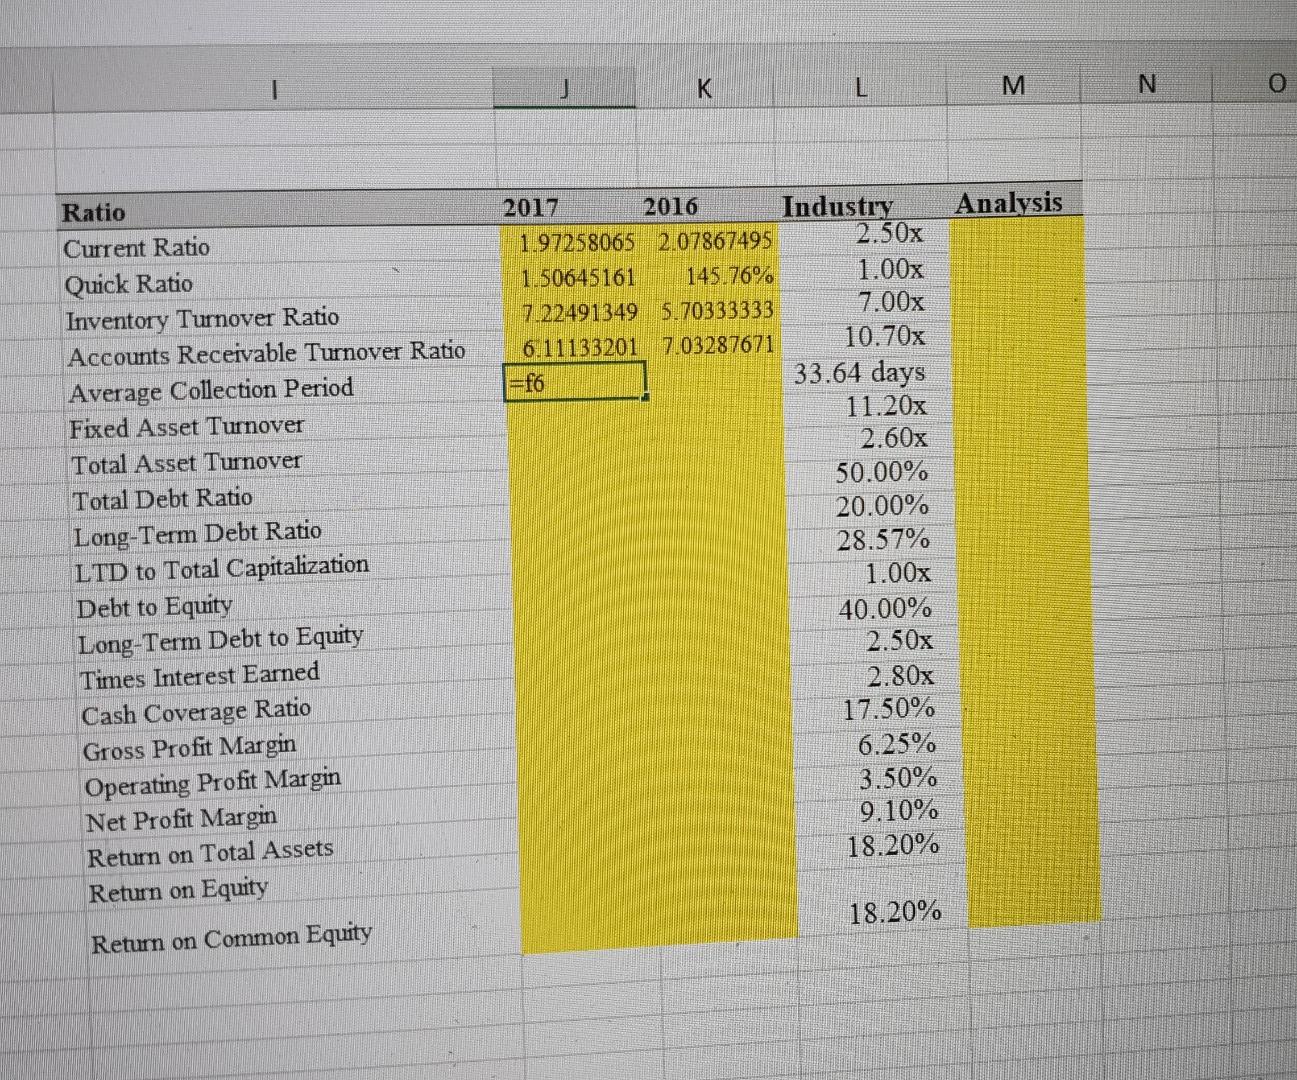
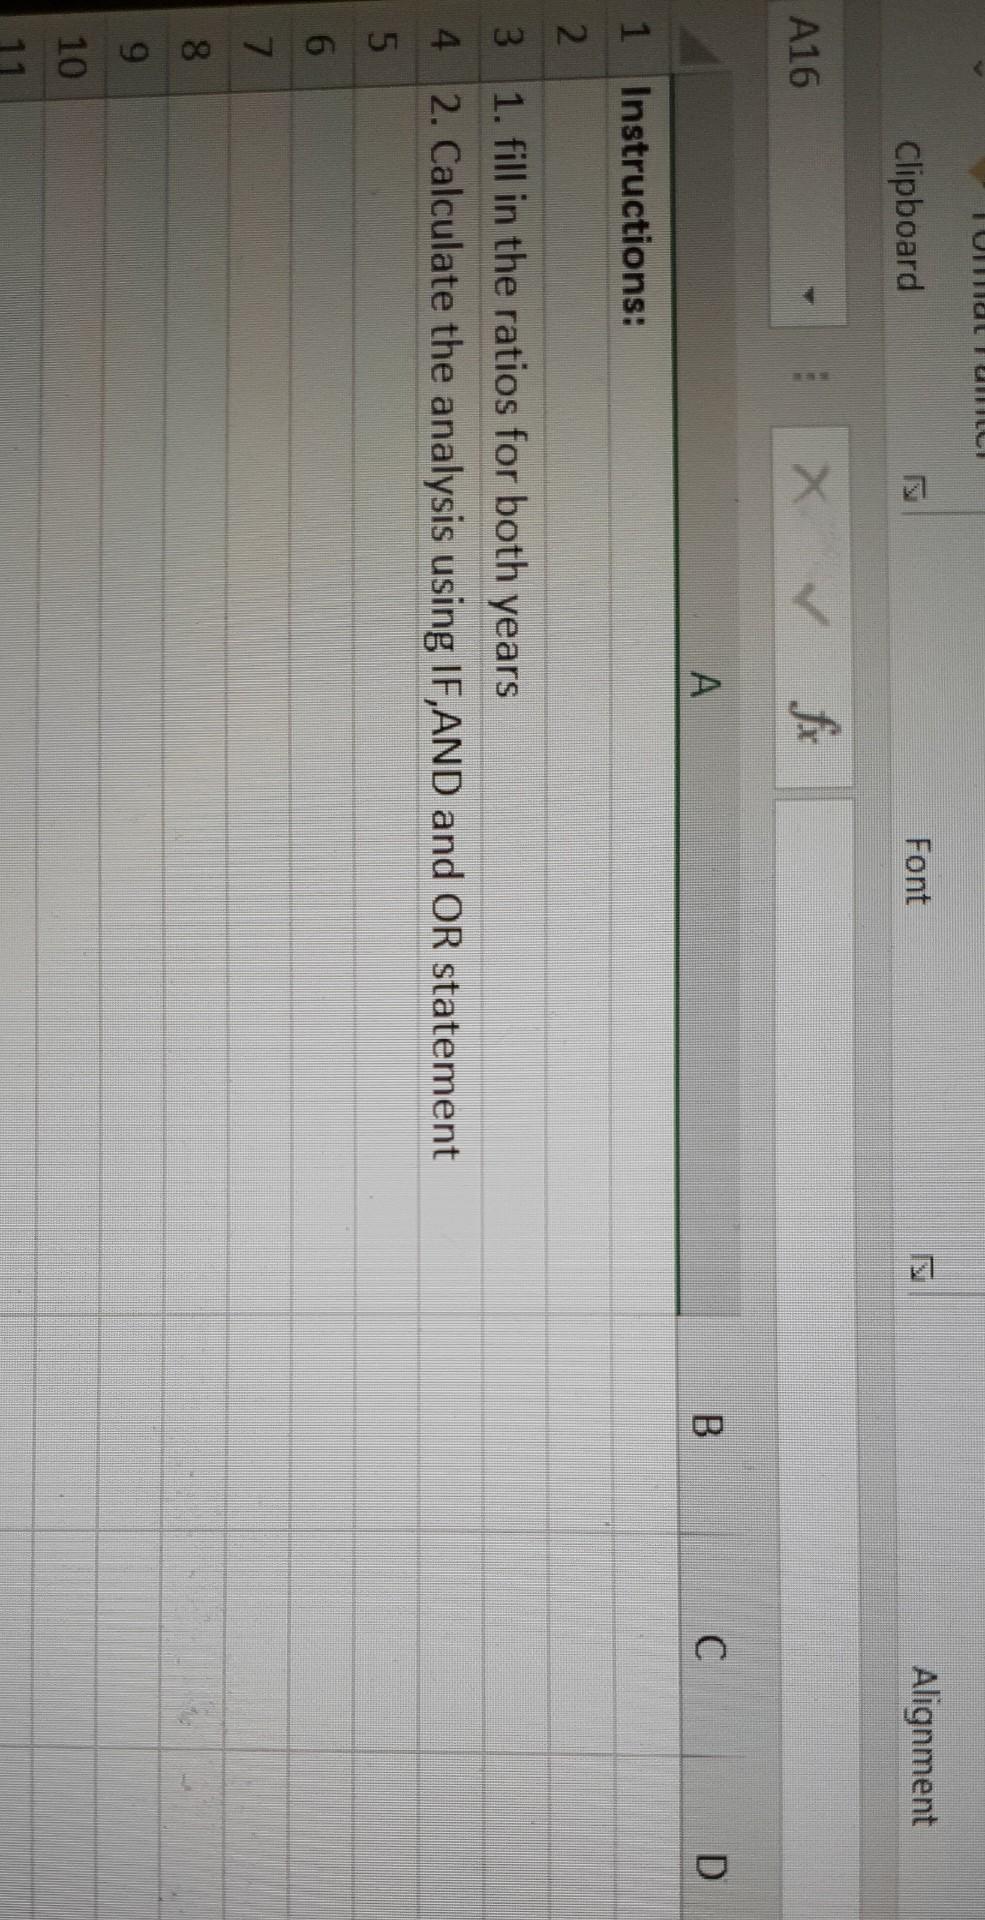
do Cut A A 2. Wap Test General M Copy Paste - BIU Merde 8 Center Format Painter 96 Insert Delete Format done tional Format as Cell Formatting Table Styles Styles Clipboard Font s Alignment IS Number Cells COLUMN X =f6 A B D H K M 1 Sweet Dreams Corp. Analys 2016 2 Income Statement 3 For the Year Ended Dec. 31 2017 4 2017 5 Sales 30,74_000 6 Cost of Goods Sold 20.88,000 7. Gross Profit 9,86,000 8 Selling and G&A Expenses 294,000 9 Fixed Expenses 35,000 10 Depreciation Expense 2,39,000 11 EBIT 4.18,000 12 Interest Expense 93.000 13 Earrings Before Taxes 3,25,000 14 Taxes 94,000 15 Net Income 2,31,000 16 17 18 19 20 21 22 25.67.000 17,11,000 8,56,000 295.000 35.000 2,23,000 3,03,000 91,000 2,12,000 64.000 1,48,000 E F G Sweet Dreams Corp. Balance Sheet As of Dec. 31 2017 Assets 2012 2016 Cash 4.31,000 3.39,000 Accounts Receivable 5,03,000 3,65,000 Inventones 2.89,000 3,00.000 Total Current Assets 12,23,000 10,04,000 Gross Fixed Assets 46.69,000 43,22,000 Accumulated Depreciation 22,95.000 20,56.000 Net Fixed Assets 23.74,000 22,66,000. Total Assets 35,97,000 32,70,000 Liabilities and Owners' Equity Accounts Payable 3.82.000 2.70,000 Short-term Notes Payable 99,000 Accrued Expenses 1.59.000 1.14,000 Total Current Liabilities 6,20,000 4,83,000 Long-term Debt 10,23,000 967,000 Total Liabilities 16,43,000 14,50,000 Common Stock 8.19.000 8.08,000 Retained Eamings 11,35,000 10.12.000 Total Shareholder's Equity 19,54,000 18,20,000 Ratio Current Ratio Quick Ratio Inventory Turnover Ratio Accounts Receivable Turnover Ratio Average Collection Period Fixed Asset Turnover Total Asset Turnover Total Debt Ratio Long-Term Debt Ratio LTD to Total Capitalization Debt to Equity Long-Term Debt to Equity Times Interest Earned Cash Coverage Ratio Gross Profit Margin Operating Profit Margin Net Profit Margin Return on Total Assets Return on Equity 2017 2016 Industry 1.97258065 2.07867495 2.50x 1.50645161 145.76% 1.00x 7.22491349 5.70333333 7.00x 6.111332017.03287671 10.70x =f6 33.64 days 11.20x 2.60x 50.00% 20.00% 28.57% 1.00x 40.00% 2.50x 2.80x 17.50% 6.25% 3.50% 9.10% 18.20% 79.000 Total Liabilities and Owners' Equity 35,97,000 32,70,000 Return on Common Equity 18.20% 23 24 25 26 27 28 29 30 31 32 33 + Data Instructions T K M N o Ratio Current Ratio Quick Ratio Inventory Turnover Ratio Accounts Receivable Turnover Ratio Average Collection Period Fixed Asset Turnover Total Asset Turnover Total Debt Ratio Long-Term Debt Ratio LTD to Total Capitalization Debt to Equity Long-Term Debt to Equity Times Interest Earned Cash Coverage Ratio Gross Profit Margin Operating Profit Margin Net Profit Margin Return on Total Assets Return on Equity 2017 2016 Industry Analysis 1.97258065 2.07867495 2.50x 1.50645161 145.76% 1.00x 7.22491349 5.70333333 7.00x 6.11133201 7.03287671 10.70x =f6 33.64 days 11.20x 2.60x 50.00% 20.00% 28.57% 1.00x 40.00% 2.50x 2.80x 17.50% 6.25% 3.50% 9.10% 18.20% 18.20% Return on Common Equity TUICILITI Clipboard Font Alignment A16 X fx A B D 1 Instructions: 2 3 1. fill in the ratios for both years 4 2. Calculate the analysis using IF,AND and OR statement 5 6 7 8 9 10 11 do Cut A A 2. Wap Test General M Copy Paste - BIU Merde 8 Center Format Painter 96 Insert Delete Format done tional Format as Cell Formatting Table Styles Styles Clipboard Font s Alignment IS Number Cells COLUMN X =f6 A B D H K M 1 Sweet Dreams Corp. Analys 2016 2 Income Statement 3 For the Year Ended Dec. 31 2017 4 2017 5 Sales 30,74_000 6 Cost of Goods Sold 20.88,000 7. Gross Profit 9,86,000 8 Selling and G&A Expenses 294,000 9 Fixed Expenses 35,000 10 Depreciation Expense 2,39,000 11 EBIT 4.18,000 12 Interest Expense 93.000 13 Earrings Before Taxes 3,25,000 14 Taxes 94,000 15 Net Income 2,31,000 16 17 18 19 20 21 22 25.67.000 17,11,000 8,56,000 295.000 35.000 2,23,000 3,03,000 91,000 2,12,000 64.000 1,48,000 E F G Sweet Dreams Corp. Balance Sheet As of Dec. 31 2017 Assets 2012 2016 Cash 4.31,000 3.39,000 Accounts Receivable 5,03,000 3,65,000 Inventones 2.89,000 3,00.000 Total Current Assets 12,23,000 10,04,000 Gross Fixed Assets 46.69,000 43,22,000 Accumulated Depreciation 22,95.000 20,56.000 Net Fixed Assets 23.74,000 22,66,000. Total Assets 35,97,000 32,70,000 Liabilities and Owners' Equity Accounts Payable 3.82.000 2.70,000 Short-term Notes Payable 99,000 Accrued Expenses 1.59.000 1.14,000 Total Current Liabilities 6,20,000 4,83,000 Long-term Debt 10,23,000 967,000 Total Liabilities 16,43,000 14,50,000 Common Stock 8.19.000 8.08,000 Retained Eamings 11,35,000 10.12.000 Total Shareholder's Equity 19,54,000 18,20,000 Ratio Current Ratio Quick Ratio Inventory Turnover Ratio Accounts Receivable Turnover Ratio Average Collection Period Fixed Asset Turnover Total Asset Turnover Total Debt Ratio Long-Term Debt Ratio LTD to Total Capitalization Debt to Equity Long-Term Debt to Equity Times Interest Earned Cash Coverage Ratio Gross Profit Margin Operating Profit Margin Net Profit Margin Return on Total Assets Return on Equity 2017 2016 Industry 1.97258065 2.07867495 2.50x 1.50645161 145.76% 1.00x 7.22491349 5.70333333 7.00x 6.111332017.03287671 10.70x =f6 33.64 days 11.20x 2.60x 50.00% 20.00% 28.57% 1.00x 40.00% 2.50x 2.80x 17.50% 6.25% 3.50% 9.10% 18.20% 79.000 Total Liabilities and Owners' Equity 35,97,000 32,70,000 Return on Common Equity 18.20% 23 24 25 26 27 28 29 30 31 32 33 + Data Instructions T K M N o Ratio Current Ratio Quick Ratio Inventory Turnover Ratio Accounts Receivable Turnover Ratio Average Collection Period Fixed Asset Turnover Total Asset Turnover Total Debt Ratio Long-Term Debt Ratio LTD to Total Capitalization Debt to Equity Long-Term Debt to Equity Times Interest Earned Cash Coverage Ratio Gross Profit Margin Operating Profit Margin Net Profit Margin Return on Total Assets Return on Equity 2017 2016 Industry Analysis 1.97258065 2.07867495 2.50x 1.50645161 145.76% 1.00x 7.22491349 5.70333333 7.00x 6.11133201 7.03287671 10.70x =f6 33.64 days 11.20x 2.60x 50.00% 20.00% 28.57% 1.00x 40.00% 2.50x 2.80x 17.50% 6.25% 3.50% 9.10% 18.20% 18.20% Return on Common Equity TUICILITI Clipboard Font Alignment A16 X fx A B D 1 Instructions: 2 3 1. fill in the ratios for both years 4 2. Calculate the analysis using IF,AND and OR statement 5 6 7 8 9 10 11
Step by Step Solution
There are 3 Steps involved in it

Get step-by-step solutions from verified subject matter experts