

Question: plss answer t's Visualize! Follow the steps to visualize Frequency Distribution and Normal Distribution ks: Visualize Frequency Distribution. X(Score) Sketch the frequency polygon of the
plss answer
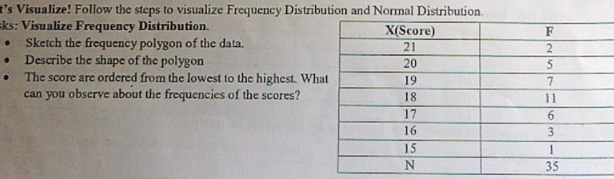
t's Visualize! Follow the steps to visualize Frequency Distribution and Normal Distribution ks: Visualize Frequency Distribution. X(Score) Sketch the frequency polygon of the data, 21 Describe the shape of the polygon 20 The score are ordered from the lowest to the highest What 19 can you observe about the frequencies of the scores? 18 11 17 16 15 N 35
Step by Step Solution
There are 3 Steps involved in it
1 Expert Approved Answer
Step: 1 Unlock

Question Has Been Solved by an Expert!
Get step-by-step solutions from verified subject matter experts
Step: 2 Unlock
Step: 3 Unlock