

Question: plz help me by writing down the excel operating steps 0.30 Adjusted Closing Prio Date SPX AMZN BAC CSCO FB JNJ XOM Tbil 2015/12/31 2043.94
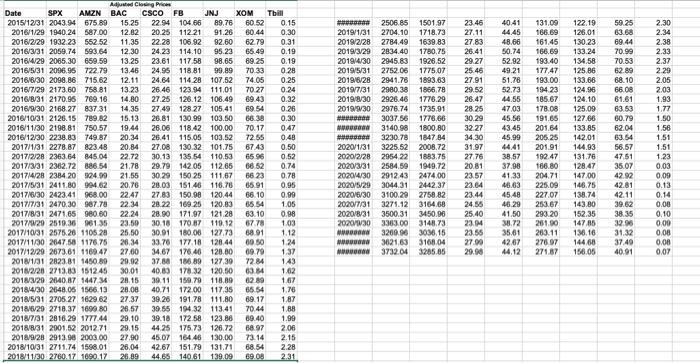
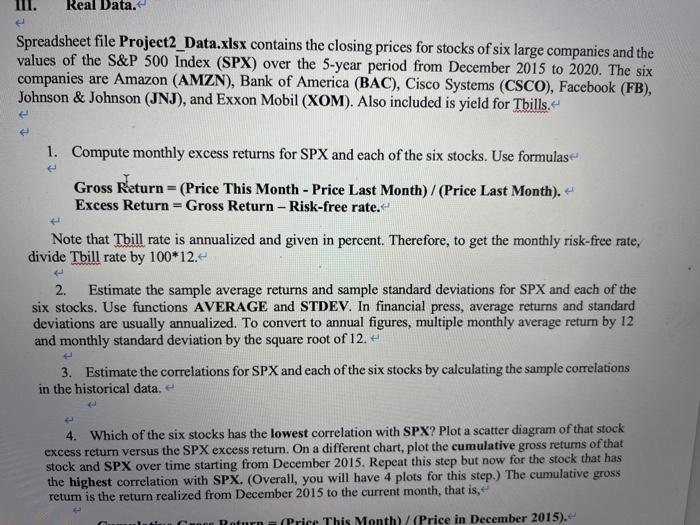
0.30 Adjusted Closing Prio Date SPX AMZN BAC CSCO FB JNJ XOM Tbil 2015/12/31 2043.94 675 89 15.25 22.94 104 66 89.76 60.52 0.15 2016/1/29 1940.24 587.00 12.82 20.25 11221 91.26 80.44 2016/2/29 1932.23 552.52 11.35 22.28 106.92 92.60 62.79 0.31 2016/3/31 2059.74 593.64 12.30 24.23 114.10 95.23 65.49 0.19 20164/29 2065.30 659.59 13.25 23.61 117.58 98.65 69.25 0.19 2016/5/31 2096.96 722.79 13.46 24.95 118,81 99.89 70.33 0.28 2016/6/30 2098.86 715.62 12.11 24.64 114 28 107.52 7405 0.25 2016/7/29 2173.60 758 81 13.23 26.46 123.94 111,01 70.27 0.24 2016/8/31 2170.96 769.16 14.80 27.25 126.12 106.49 69.43 0.32 2016/9/30 2168.27 837 31 14,35 27 49 128 27 105.41 69 54 0.26 2016/10/31 2126.15 789.82 15.13 26.81 130 99 103.50 66.30 0.30 2016/11/30 2198.81 750.57 19.44 26.06 118.42 100.00 70.17 047 2016/12/30 2238.83 749.87 20.34 26.41 115.05 103.52 72.55 0.48 2017/1/31 2278.87 823.48 20.84 27.08 130.32 101.75 6743 0.50 2017/2/28 2363.64 84504 22.72 30.13 135 54 110.53 65 96 0.52 2017/3/31 2362.72 886,54 21.78 29.79 142.05 112.65 0652 0.74 2017/4/28 2384 20 924.99 21.55 30-29 150 25 111.67 66.23 0.78 2017/5/31 2411.80 994.62 20.76 28.03 161.46 116.78 65.91 0.95 2017/6/30 2423.41 06800 2247 27.83 150.98 120.44 66.10 0.99 2017/7/31 2470.30 987.78 22.34 28.22 169.25 120.83 65.54 1.05 2017/8/31 247165 980.60 2224 28.90 171.97 12128 63.10 0.98 2017/029 2519.36 96135 23.50 30.18 170 87119.12 6778 1.03 2017/10/31 2575.28 1105 28 25.50 30.91 180.08 127.73 68.91 1.12 2017/11/30 2647 50 1176 75 26,34 3376 177 18 126.44 60.50 2017/12/29 2673.61 1169 47 27.00 34.67 176.40 128.00 09.70 1.37 2018/1/31 2823.81 1450.80 29.92 37.86 186 89 127.30 7284 1.43 2011/2/28 2713.63 151245 30.01 40.80 178.32 120,50 1.62 2018/320 2040 87 14473 2015 30.11 159.79 118.80 62 80 1.67 20184/30 2648.05 1566.13 28.08 40.71 172.00 117.35 65 54 1.76 2018/5/31 2705.27 1629.62 27.37 38.26 191.78 111.80 69.17 1.87 2018/6/29 2718.37 1699 80 26.57 39.55 104 32 113.41 70.44 1 BA 2018/7/31 2816.29 1777.44 29.10 39.18 172.58 123.88 89.40 1.99 2018/8/31 2001,52 201271 29.15 44.25 175.73 126.72 68.97 2.06 2018/9/28 2913.90 200300 27.90 45.07 164.46 130.00 73.14 2.15 2018/10/31 2711.74 1598.01 26.04 42.67 151.79 131.71 68.54 2.28 2018/11/30 2760.17 1690.17 26.89 44.65 140,61 139.09 2506.85 1501 97 2019/1/31 2704.10 1718.73 2019/2/28 2784.49 1639.83 2019/3/29 2834.40 1780.75 2019/4/30 2945.83 1928.52 2019/5/31 2752.06 1775.07 2019/8/28 2941.76 1893.63 2019/7/31 2980.38 1866 78 2019/8/30 2926.46 1776,20 2019/9/30 2976.74 1735,91 2 3037.56 1778.66 3140.90 1800.80 3230.78 1847 84 2020/1/31 3225.52 2008.72 2020/2/28 2954 22 1883.75 20207331 2584.59 1949.72 202014/30 2912.43 2474.00 2020/5/29 304431 2442.37 2020/6/30 3100.20 2758.82 2020/7/31 3271.12 316468 2020/8/31 3500.31 3450.98 2020/W30 3363.00 3148.73 MMD 3260.96 3036.15 MD 3621,63 3168.04 M 3732.04 3285.85 23.46 27.11 27.83 26.41 29.27 25.46 2791 29.52 26.47 28.25 30.29 32 27 34.30 31.97 27.76 20.81 23.57 23.64 23.44 24.55 25.40 23.014 23.55 27.90 20.00 40.41 44.45 48.68 50.74 52.92 49.21 51.78 52.73 44.55 4703 45.56 43.45 45.99 4441 38.57 37.98 41.33 45.63 45.48 46.29 41.50 38.72 35.61 42.67 44,12 131,09 166.69 161.45 166.69 193.40 177,47 193.00 194 23 185.67 178.00 191.66 201.64 206.25 201.91 192.47 166.80 204.71 225.09 227.07 253.67 293.20 261.90 263.11 27897 271.87 122.19 126.01 130.23 133.24 134,58 125 86 133.66 124.96 124.10 125.09 127.66 133.85 142.01 144.93 131.76 128.47 147,00 146.75 138.74 143.80 152.35 147.85 136.16 14460 16.05 50.25 63.68 69.44 70.99 70.53 62.89 68.10 66.08 61.61 63.53 60.79 62.04 63.54 56.57 47.51 35.07 42.92 42.81 42.11 39.62 38.35 32.00 31.32 37.40 40.91 2.30 2.34 2.38 2.33 2.37 2.29 2.05 2.03 1.93 1.77 1.50 1.56 1.51 1.51 1.23 0.03 0.09 0.13 0.14 0.00 0.10 0.00 0.08 0.00 0.07 1.24 035 Real Data. Spreadsheet file Project2_Data.xlsx contains the closing prices for stocks of six large companies and the values of the S&P 500 Index (SPX) over the 5-year period from December 2015 to 2020. The six companies are Amazon (AMZN), Bank of America (BAC), Cisco Systems (CSCO), Facebook (FB), Johnson & Johnson (JNJ), and Exxon Mobil (XOM). Also included is yield for Tbills. 1. Compute monthly excess returns for SPX and each of the six stocks. Use formulas Gross Return = (Price This Month - Price Last Month)/(Price Last Month). Excess Return = Gross Return - Risk-free rate. Note that Thill rate is annualized and given in percent. Therefore, to get the monthly risk-free rate, divide Thill rate by 100*12. 2. Estimate the sample average returns and sample standard deviations for SPX and each of the six stocks. Use functions AVERAGE and STDEV. In financial press, average returns and standard deviations are usually annualized. To convert to annual figures, multiple monthly average return by 12 and monthly standard deviation by the square root of 12. 3. Estimate the correlations for SPX and each of the six stocks by calculating the sample correlations in the historical data. 4. Which of the six stocks has the lowest correlation with SPX? Plot a scatter diagram of that stock excess return versus the SPX excess retum. On a different chart, plot the cumulative gross retums of that stock and SPX over time starting from December 2015. Repeat this step but now for the stock that has the highest correlation with SPX. (Overall, you will have 4 plots for this step.) The cumulative gross retum is the return realized from December 2015 to the current month, that is, tin Poturn (Price This Month)/(Price in December 2015). 0.30 Adjusted Closing Prio Date SPX AMZN BAC CSCO FB JNJ XOM Tbil 2015/12/31 2043.94 675 89 15.25 22.94 104 66 89.76 60.52 0.15 2016/1/29 1940.24 587.00 12.82 20.25 11221 91.26 80.44 2016/2/29 1932.23 552.52 11.35 22.28 106.92 92.60 62.79 0.31 2016/3/31 2059.74 593.64 12.30 24.23 114.10 95.23 65.49 0.19 20164/29 2065.30 659.59 13.25 23.61 117.58 98.65 69.25 0.19 2016/5/31 2096.96 722.79 13.46 24.95 118,81 99.89 70.33 0.28 2016/6/30 2098.86 715.62 12.11 24.64 114 28 107.52 7405 0.25 2016/7/29 2173.60 758 81 13.23 26.46 123.94 111,01 70.27 0.24 2016/8/31 2170.96 769.16 14.80 27.25 126.12 106.49 69.43 0.32 2016/9/30 2168.27 837 31 14,35 27 49 128 27 105.41 69 54 0.26 2016/10/31 2126.15 789.82 15.13 26.81 130 99 103.50 66.30 0.30 2016/11/30 2198.81 750.57 19.44 26.06 118.42 100.00 70.17 047 2016/12/30 2238.83 749.87 20.34 26.41 115.05 103.52 72.55 0.48 2017/1/31 2278.87 823.48 20.84 27.08 130.32 101.75 6743 0.50 2017/2/28 2363.64 84504 22.72 30.13 135 54 110.53 65 96 0.52 2017/3/31 2362.72 886,54 21.78 29.79 142.05 112.65 0652 0.74 2017/4/28 2384 20 924.99 21.55 30-29 150 25 111.67 66.23 0.78 2017/5/31 2411.80 994.62 20.76 28.03 161.46 116.78 65.91 0.95 2017/6/30 2423.41 06800 2247 27.83 150.98 120.44 66.10 0.99 2017/7/31 2470.30 987.78 22.34 28.22 169.25 120.83 65.54 1.05 2017/8/31 247165 980.60 2224 28.90 171.97 12128 63.10 0.98 2017/029 2519.36 96135 23.50 30.18 170 87119.12 6778 1.03 2017/10/31 2575.28 1105 28 25.50 30.91 180.08 127.73 68.91 1.12 2017/11/30 2647 50 1176 75 26,34 3376 177 18 126.44 60.50 2017/12/29 2673.61 1169 47 27.00 34.67 176.40 128.00 09.70 1.37 2018/1/31 2823.81 1450.80 29.92 37.86 186 89 127.30 7284 1.43 2011/2/28 2713.63 151245 30.01 40.80 178.32 120,50 1.62 2018/320 2040 87 14473 2015 30.11 159.79 118.80 62 80 1.67 20184/30 2648.05 1566.13 28.08 40.71 172.00 117.35 65 54 1.76 2018/5/31 2705.27 1629.62 27.37 38.26 191.78 111.80 69.17 1.87 2018/6/29 2718.37 1699 80 26.57 39.55 104 32 113.41 70.44 1 BA 2018/7/31 2816.29 1777.44 29.10 39.18 172.58 123.88 89.40 1.99 2018/8/31 2001,52 201271 29.15 44.25 175.73 126.72 68.97 2.06 2018/9/28 2913.90 200300 27.90 45.07 164.46 130.00 73.14 2.15 2018/10/31 2711.74 1598.01 26.04 42.67 151.79 131.71 68.54 2.28 2018/11/30 2760.17 1690.17 26.89 44.65 140,61 139.09 2506.85 1501 97 2019/1/31 2704.10 1718.73 2019/2/28 2784.49 1639.83 2019/3/29 2834.40 1780.75 2019/4/30 2945.83 1928.52 2019/5/31 2752.06 1775.07 2019/8/28 2941.76 1893.63 2019/7/31 2980.38 1866 78 2019/8/30 2926.46 1776,20 2019/9/30 2976.74 1735,91 2 3037.56 1778.66 3140.90 1800.80 3230.78 1847 84 2020/1/31 3225.52 2008.72 2020/2/28 2954 22 1883.75 20207331 2584.59 1949.72 202014/30 2912.43 2474.00 2020/5/29 304431 2442.37 2020/6/30 3100.20 2758.82 2020/7/31 3271.12 316468 2020/8/31 3500.31 3450.98 2020/W30 3363.00 3148.73 MMD 3260.96 3036.15 MD 3621,63 3168.04 M 3732.04 3285.85 23.46 27.11 27.83 26.41 29.27 25.46 2791 29.52 26.47 28.25 30.29 32 27 34.30 31.97 27.76 20.81 23.57 23.64 23.44 24.55 25.40 23.014 23.55 27.90 20.00 40.41 44.45 48.68 50.74 52.92 49.21 51.78 52.73 44.55 4703 45.56 43.45 45.99 4441 38.57 37.98 41.33 45.63 45.48 46.29 41.50 38.72 35.61 42.67 44,12 131,09 166.69 161.45 166.69 193.40 177,47 193.00 194 23 185.67 178.00 191.66 201.64 206.25 201.91 192.47 166.80 204.71 225.09 227.07 253.67 293.20 261.90 263.11 27897 271.87 122.19 126.01 130.23 133.24 134,58 125 86 133.66 124.96 124.10 125.09 127.66 133.85 142.01 144.93 131.76 128.47 147,00 146.75 138.74 143.80 152.35 147.85 136.16 14460 16.05 50.25 63.68 69.44 70.99 70.53 62.89 68.10 66.08 61.61 63.53 60.79 62.04 63.54 56.57 47.51 35.07 42.92 42.81 42.11 39.62 38.35 32.00 31.32 37.40 40.91 2.30 2.34 2.38 2.33 2.37 2.29 2.05 2.03 1.93 1.77 1.50 1.56 1.51 1.51 1.23 0.03 0.09 0.13 0.14 0.00 0.10 0.00 0.08 0.00 0.07 1.24 035 Real Data. Spreadsheet file Project2_Data.xlsx contains the closing prices for stocks of six large companies and the values of the S&P 500 Index (SPX) over the 5-year period from December 2015 to 2020. The six companies are Amazon (AMZN), Bank of America (BAC), Cisco Systems (CSCO), Facebook (FB), Johnson & Johnson (JNJ), and Exxon Mobil (XOM). Also included is yield for Tbills. 1. Compute monthly excess returns for SPX and each of the six stocks. Use formulas Gross Return = (Price This Month - Price Last Month)/(Price Last Month). Excess Return = Gross Return - Risk-free rate. Note that Thill rate is annualized and given in percent. Therefore, to get the monthly risk-free rate, divide Thill rate by 100*12. 2. Estimate the sample average returns and sample standard deviations for SPX and each of the six stocks. Use functions AVERAGE and STDEV. In financial press, average returns and standard deviations are usually annualized. To convert to annual figures, multiple monthly average return by 12 and monthly standard deviation by the square root of 12. 3. Estimate the correlations for SPX and each of the six stocks by calculating the sample correlations in the historical data. 4. Which of the six stocks has the lowest correlation with SPX? Plot a scatter diagram of that stock excess return versus the SPX excess retum. On a different chart, plot the cumulative gross retums of that stock and SPX over time starting from December 2015. Repeat this step but now for the stock that has the highest correlation with SPX. (Overall, you will have 4 plots for this step.) The cumulative gross retum is the return realized from December 2015 to the current month, that is, tin Poturn (Price This Month)/(Price in December 2015)
Step by Step Solution
There are 3 Steps involved in it

Get step-by-step solutions from verified subject matter experts