

Question: tell me the excel steps plz . K L M N o P o R S 95.23 99.89 0.30 D F G Adjusted Cloning Prim
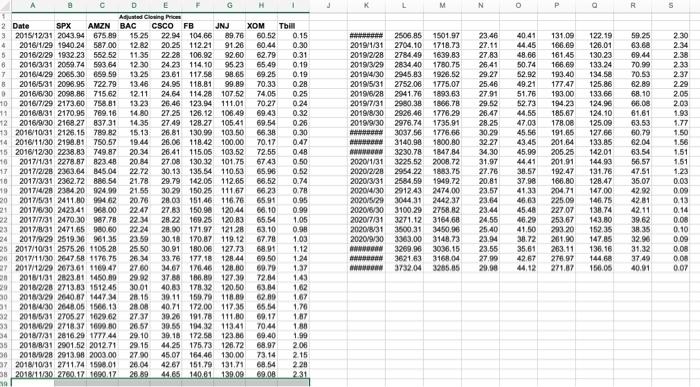
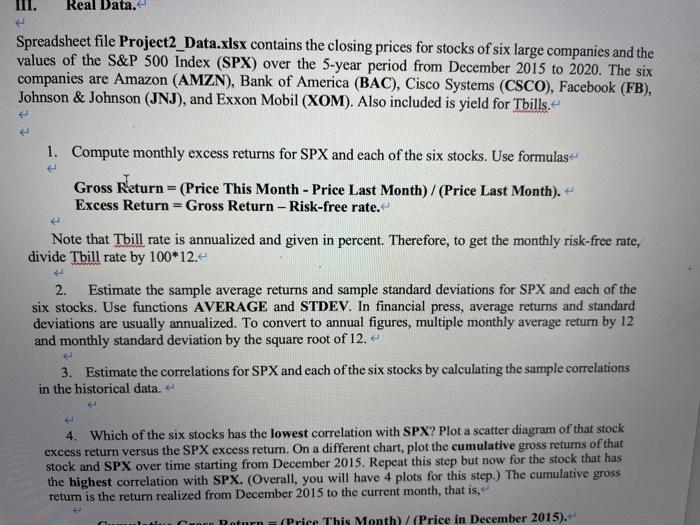
. K L M N o P o R S 95.23 99.89 0.30 D F G Adjusted Cloning Prim 2 Date SPX AMZN BAC CSCO FB JNJ XOM Tbil 3 2015/12/31 2043.94 675 89 15.25 22.94 104.66 89.76 60.52 0.15 4 2016/1/29 1940.24 587.00 1282 20.25 112.21 91.26 80.44 0.30 5 2016/2/29 1932.23 552 52 11.35 22.28 106.92 92.60 62.79 0.31 6 2016/3/31 2059.74 593 64 12.30 24 23 114,10 65.49 0.19 7 2016/4/29 2065.30 659 59 13.25 23.61 117.58 98.65 69.25 0.19 8 2016/5/31 2098.95 722.79 13.48 24.95 118.81 70.33 0.28 3 2016/6/30 2098.86 715,62 1211 24.64 114.28 107.52 74.05 0.25 10 2016/7/29 2173.60 758.81 13 23 26.46 123.94 111,01 70.27 0.24 11 2016/8/31 2170.95 769.16 14.80 27 25 126.12 106.49 69.43 0.32 12 2016/9/30 2168.27 837.31 14.35 27.49 128.27 105.41 69.54 0.26 13 2016/10/31 2126.15 789 82 15.13 26.81 130,99 103.50 66.38 14 2016/11/30 2199.81 750.57 19.44 26.06 118.42 100.00 70.17 0.47 15 2016/12/30 2238 83 749.87 20.34 26.41 115.05 103.52 72.55 0.48 10 2017/1/31 2278.87 823.48 20.84 27.08 130,32 101.75 6743 0.50 17 2017/2/28 2363.64 845.04 22.72 30.13 135.54 110.53 65.96 0.52 10 2017/3/31 2362.72 886.54 21.78 29.79 142.06 112.65 68.52 0.74 19 2017/4/28 2384 20 924.99 21.55 30.29 150.25 111.57 66.23 0.78 20 2017/5/31 2411,80 994 62 20.76 28.03 15146 116.76 65.91 21 2017/6/30 2423.41 968.00 22.47 27.83 150.98 120.44 66,10 0.99 22 2017/7/31 2470.30 987.78 22.34 28.22 169.25 120.83 65.54 1.05 2017/8/31 2471,65 960.60 22 24 28.90 171.97 12128 63.10 0.98 24 2017/9/29 2519.36 961 35 23.59 30.18 170.87 119.12 67.78 1.03 25 2017/10/31 2575.26 1105 28 25 50 30.91 180.06 127.73 68.91 1.12 28 2017/11/30 2647 58 1176.75 26 34 33.78 177.18 12844 69.50 27 2017/12/29 2673,61 1169.47 27.60 34.67 176.46 128.00 69.70 1.37 20161/31 2823,81 1450.89 29.92 37.88 188,89 127,30 72.84 143 20 2018/2/28 2713,83 151245 30.01 40.83 178.32 120,50 63.84 1.62 30 2010/320 2540.87 1447 34 28.15 39.11 159.79 118.89 62 80 1.67 31 2016/4/30 2648.05 1566.13 2808 40.71 172,00 117,35 65.54 1.70 2016/5/31 2705 27 1029 62 2737 39.28 191.78 111.80 69.17 187 3 2018/620 2718.37 1090 80 26 57 39.56 194,32 113.41 7044 1.80 34 2018/7/31 2816 29 1777.44 29.10 39.18 172.58 123.86 89.40 1.99 35 2018/8/31 2901.52 2012.71 29.15 44.25 175.73 126.72 68.97 2.06 2018/928 2913.98 2003.00 27.90 45.07 164,46 130.00 73.14 215 7 2018/10/31 2711.74 1598.01 26.04 42.67 151.79 131,71 68.54 2.28 201811:20 2760.17 1890.17 26.89 44.65 140,61 139.09 69.08 19 2506.85 1501.97 2019/1/31 2704.10 1718.73 2019/2/28 2784.49 1639.83 2019/3/29 283440 1780.75 201944/30 2945.83 1926.52 2019/5/31 2752.06 1775.07 2019/6/28 2941.76 1893.63 2019/7/31 2980.38 1866.78 2019/8/30 2926.46 1776.29 2019/9/30 2976.74 1735,91 ### 3037 56 1776.66 3140.98 1800.80 3230.78 1847 84 2020/1/31 3225.52 2008.72 2020/2/28 295422 1883.75 2020/3/31 2584.59 1949.72 20204/30 291243 2474.00 2020/5/29 3044.31 2442,37 2020/6/30 3100.29 2758.82 2020/7/31 3271.12 316468 2020/831 3500.31 3450.00 202079/30 3363.00 3148.73 3269.96 3036.15 3621.63 316804 Www 3732.04 3285.85 23.46 27.11 27.83 26 41 29.27 25.46 27.91 29.52 26.47 28.25 30.29 32.27 34.30 31.97 27.76 20.81 23.57 23.64 23.44 24.55 25.40 23.94 23.55 27,90 20.98 40 41 44.45 48.66 50.74 52.92 49.21 51.76 52.73 44.55 47.03 45.56 43.45 45.99 4441 38.57 37.98 41.33 46.63 45.48 46.29 41.50 30.72 35.61 42.67 44.12 131.09 166.69 161.45 166.69 193.40 177.47 193.00 194.23 185.67 178.08 191.65 201.64 205.25 20191 192.47 166.80 204 71 225.00 227.07 253.67 293.20 201 90 263.11 276.97 271.87 122.19 126.01 130.23 133.24 134.58 125.86 133.66 124.96 124.10 125.09 127,66 133.85 142.01 144.90 131.76 128.47 147.00 146.75 138.74 143.80 152.35 147.85 136,16 144 68 150.00 230 2.34 2.38 2.33 2.37 2.29 2.05 2.03 1.93 1.77 1.50 1.56 1.51 1.51 1.23 0.03 0.09 59.25 63.68 69.44 70.99 70.53 62.89 68.10 66.08 61.61 63.53 60.79 62.04 63.54 56.57 47.51 35.07 42.92 42.81 42.11 39.62 38.35 3290 31.32 37 49 40.01 095 0.13 0.14 0.08 0.10 0.09 0.08 0.00 0.07 1.24 Real Data. Spreadsheet file Project2_Data.xlsx contains the closing prices for stocks of six large companies and the values of the S&P 500 Index (SPX) over the 5-year period from December 2015 to 2020. The six companies are Amazon (AMZN), Bank of America (BAC), Cisco Systems (CSCO), Facebook (FB), Johnson & Johnson (JNJ), and Exxon Mobil (XOM). Also included is yield for Tbills. 1. Compute monthly excess returns for SPX and each of the six stocks. Use formulas Gross Return = (Price This Month - Price Last Month)/(Price Last Month). Excess Return = Gross Return - Risk-free rate. Note that Thill rate is annualized and given in percent. Therefore, to get the monthly risk-free rate, divide Thill rate by 100*12. 2. Estimate the sample average returns and sample standard deviations for SPX and each of the six stocks. Use functions AVERAGE and STDEV. In financial press, average returns and standard deviations are usually annualized. To convert to annual figures, multiple monthly average return by 12 and monthly standard deviation by the square root of 12. 3. Estimate the correlations for SPX and each of the six stocks by calculating the sample correlations in the historical data. 4. Which of the six stocks has the lowest correlation with SPX? Plot a scatter diagram of that stock excess return versus the SPX excess retum. On a different chart, plot the cumulative gross retums of that stock and SPX over time starting from December 2015. Repeat this step but now for the stock that has the highest correlation with SPX. (Overall, you will have 4 plots for this step.) The cumulative gross retum is the return realized from December 2015 to the current month, that is, tin Poturn (Price This Month)/(Price in December 2015). . K L M N o P o R S 95.23 99.89 0.30 D F G Adjusted Cloning Prim 2 Date SPX AMZN BAC CSCO FB JNJ XOM Tbil 3 2015/12/31 2043.94 675 89 15.25 22.94 104.66 89.76 60.52 0.15 4 2016/1/29 1940.24 587.00 1282 20.25 112.21 91.26 80.44 0.30 5 2016/2/29 1932.23 552 52 11.35 22.28 106.92 92.60 62.79 0.31 6 2016/3/31 2059.74 593 64 12.30 24 23 114,10 65.49 0.19 7 2016/4/29 2065.30 659 59 13.25 23.61 117.58 98.65 69.25 0.19 8 2016/5/31 2098.95 722.79 13.48 24.95 118.81 70.33 0.28 3 2016/6/30 2098.86 715,62 1211 24.64 114.28 107.52 74.05 0.25 10 2016/7/29 2173.60 758.81 13 23 26.46 123.94 111,01 70.27 0.24 11 2016/8/31 2170.95 769.16 14.80 27 25 126.12 106.49 69.43 0.32 12 2016/9/30 2168.27 837.31 14.35 27.49 128.27 105.41 69.54 0.26 13 2016/10/31 2126.15 789 82 15.13 26.81 130,99 103.50 66.38 14 2016/11/30 2199.81 750.57 19.44 26.06 118.42 100.00 70.17 0.47 15 2016/12/30 2238 83 749.87 20.34 26.41 115.05 103.52 72.55 0.48 10 2017/1/31 2278.87 823.48 20.84 27.08 130,32 101.75 6743 0.50 17 2017/2/28 2363.64 845.04 22.72 30.13 135.54 110.53 65.96 0.52 10 2017/3/31 2362.72 886.54 21.78 29.79 142.06 112.65 68.52 0.74 19 2017/4/28 2384 20 924.99 21.55 30.29 150.25 111.57 66.23 0.78 20 2017/5/31 2411,80 994 62 20.76 28.03 15146 116.76 65.91 21 2017/6/30 2423.41 968.00 22.47 27.83 150.98 120.44 66,10 0.99 22 2017/7/31 2470.30 987.78 22.34 28.22 169.25 120.83 65.54 1.05 2017/8/31 2471,65 960.60 22 24 28.90 171.97 12128 63.10 0.98 24 2017/9/29 2519.36 961 35 23.59 30.18 170.87 119.12 67.78 1.03 25 2017/10/31 2575.26 1105 28 25 50 30.91 180.06 127.73 68.91 1.12 28 2017/11/30 2647 58 1176.75 26 34 33.78 177.18 12844 69.50 27 2017/12/29 2673,61 1169.47 27.60 34.67 176.46 128.00 69.70 1.37 20161/31 2823,81 1450.89 29.92 37.88 188,89 127,30 72.84 143 20 2018/2/28 2713,83 151245 30.01 40.83 178.32 120,50 63.84 1.62 30 2010/320 2540.87 1447 34 28.15 39.11 159.79 118.89 62 80 1.67 31 2016/4/30 2648.05 1566.13 2808 40.71 172,00 117,35 65.54 1.70 2016/5/31 2705 27 1029 62 2737 39.28 191.78 111.80 69.17 187 3 2018/620 2718.37 1090 80 26 57 39.56 194,32 113.41 7044 1.80 34 2018/7/31 2816 29 1777.44 29.10 39.18 172.58 123.86 89.40 1.99 35 2018/8/31 2901.52 2012.71 29.15 44.25 175.73 126.72 68.97 2.06 2018/928 2913.98 2003.00 27.90 45.07 164,46 130.00 73.14 215 7 2018/10/31 2711.74 1598.01 26.04 42.67 151.79 131,71 68.54 2.28 201811:20 2760.17 1890.17 26.89 44.65 140,61 139.09 69.08 19 2506.85 1501.97 2019/1/31 2704.10 1718.73 2019/2/28 2784.49 1639.83 2019/3/29 283440 1780.75 201944/30 2945.83 1926.52 2019/5/31 2752.06 1775.07 2019/6/28 2941.76 1893.63 2019/7/31 2980.38 1866.78 2019/8/30 2926.46 1776.29 2019/9/30 2976.74 1735,91 ### 3037 56 1776.66 3140.98 1800.80 3230.78 1847 84 2020/1/31 3225.52 2008.72 2020/2/28 295422 1883.75 2020/3/31 2584.59 1949.72 20204/30 291243 2474.00 2020/5/29 3044.31 2442,37 2020/6/30 3100.29 2758.82 2020/7/31 3271.12 316468 2020/831 3500.31 3450.00 202079/30 3363.00 3148.73 3269.96 3036.15 3621.63 316804 Www 3732.04 3285.85 23.46 27.11 27.83 26 41 29.27 25.46 27.91 29.52 26.47 28.25 30.29 32.27 34.30 31.97 27.76 20.81 23.57 23.64 23.44 24.55 25.40 23.94 23.55 27,90 20.98 40 41 44.45 48.66 50.74 52.92 49.21 51.76 52.73 44.55 47.03 45.56 43.45 45.99 4441 38.57 37.98 41.33 46.63 45.48 46.29 41.50 30.72 35.61 42.67 44.12 131.09 166.69 161.45 166.69 193.40 177.47 193.00 194.23 185.67 178.08 191.65 201.64 205.25 20191 192.47 166.80 204 71 225.00 227.07 253.67 293.20 201 90 263.11 276.97 271.87 122.19 126.01 130.23 133.24 134.58 125.86 133.66 124.96 124.10 125.09 127,66 133.85 142.01 144.90 131.76 128.47 147.00 146.75 138.74 143.80 152.35 147.85 136,16 144 68 150.00 230 2.34 2.38 2.33 2.37 2.29 2.05 2.03 1.93 1.77 1.50 1.56 1.51 1.51 1.23 0.03 0.09 59.25 63.68 69.44 70.99 70.53 62.89 68.10 66.08 61.61 63.53 60.79 62.04 63.54 56.57 47.51 35.07 42.92 42.81 42.11 39.62 38.35 3290 31.32 37 49 40.01 095 0.13 0.14 0.08 0.10 0.09 0.08 0.00 0.07 1.24 Real Data. Spreadsheet file Project2_Data.xlsx contains the closing prices for stocks of six large companies and the values of the S&P 500 Index (SPX) over the 5-year period from December 2015 to 2020. The six companies are Amazon (AMZN), Bank of America (BAC), Cisco Systems (CSCO), Facebook (FB), Johnson & Johnson (JNJ), and Exxon Mobil (XOM). Also included is yield for Tbills. 1. Compute monthly excess returns for SPX and each of the six stocks. Use formulas Gross Return = (Price This Month - Price Last Month)/(Price Last Month). Excess Return = Gross Return - Risk-free rate. Note that Thill rate is annualized and given in percent. Therefore, to get the monthly risk-free rate, divide Thill rate by 100*12. 2. Estimate the sample average returns and sample standard deviations for SPX and each of the six stocks. Use functions AVERAGE and STDEV. In financial press, average returns and standard deviations are usually annualized. To convert to annual figures, multiple monthly average return by 12 and monthly standard deviation by the square root of 12. 3. Estimate the correlations for SPX and each of the six stocks by calculating the sample correlations in the historical data. 4. Which of the six stocks has the lowest correlation with SPX? Plot a scatter diagram of that stock excess return versus the SPX excess retum. On a different chart, plot the cumulative gross retums of that stock and SPX over time starting from December 2015. Repeat this step but now for the stock that has the highest correlation with SPX. (Overall, you will have 4 plots for this step.) The cumulative gross retum is the return realized from December 2015 to the current month, that is, tin Poturn (Price This Month)/(Price in December 2015)
Step by Step Solution
There are 3 Steps involved in it

Get step-by-step solutions from verified subject matter experts