

Question: please help me by writing down the Excel operating steps ,thank you so much Real Data. Spreadsheet file Project2_Data.xlsx contains the closing prices for stocks
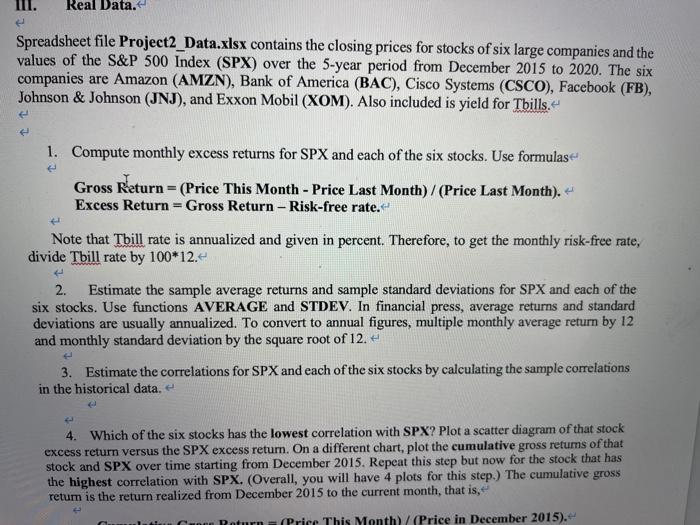
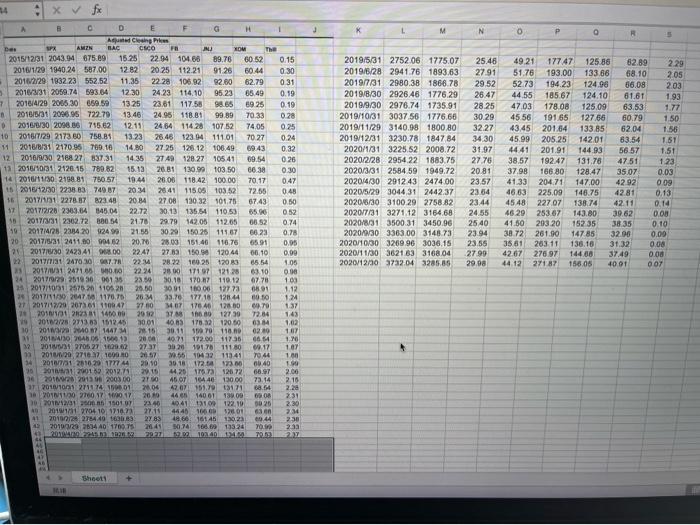
Real Data. Spreadsheet file Project2_Data.xlsx contains the closing prices for stocks of six large companies and the values of the S&P 500 Index (SPX) over the 5-year period from December 2015 to 2020. The six companies are Amazon (AMZN), Bank of America (BAC), Cisco Systems (CSCO), Facebook (FB), Johnson & Johnson (JNJ), and Exxon Mobil (XOM). Also included is yield for Tbills. 1. Compute monthly excess returns for SPX and each of the six stocks. Use formulas Gross Return = (Price This Month - Price Last Month)/(Price Last Month). Excess Return = Gross Return - Risk-free rate. Note that Thill rate is annualized and given in percent. Therefore, to get the monthly risk-free rate, divide Thill rate by 100*12. 2. Estimate the sample average returns and sample standard deviations for SPX and each of the six stocks. Use functions AVERAGE and STDEV. In financial press, average returns and standard deviations are usually annualized. To convert to annual figures, multiple monthly average return by 12 and monthly standard deviation by the square root of 12. 3. Estimate the correlations for SPX and each of the six stocks by calculating the sample correlations in the historical data. 4. Which of the six stocks has the lowest correlation with SPX? Plot a scatter diagram of that stock excess return versus the SPX excess retum. On a different chart, plot the cumulative gross retums of that stock and SPX over time starting from December 2015. Repeat this step but now for the stock that has the highest correlation with SPX. (Overall, you will have 4 plots for this step.) The cumulative gross retum is the return realized from December 2015 to the current month, that is, tin Poturn (Price This Month)/(Price in December 2015). 14 : x x M N 0 P o R 15 151 B D E F Along Des AMZN BAC CSO NJ MOM The 2015/12/31 2043.94 675.89 15.25 22.94 104.68 89.76 60 52 0.15 2016/1/29 1940 24 587.00 12.82 20.25 112.21 91.26 50.44 0.30 2012/29 1932.23 552.52 11.36 22 28 106.92 82.60 62.79 0.31 2016/3/31 2059.74 593.64 12.30 24.23 114.10 95.23 65.49 0.19 7 2016/4/29 2006 30 659 59 13.25 23.61 11758 98.56 89 25 0.19 2016/5/31 209695 722.79 13.46 24.95 118.81 99.89 70.33 0.28 D 2016/6/30 2098.86 715.62 12.11 2464 114 28 107.52 74.05 0.25 10 2016/7/29 2173 80 758.89 13.23 26.48 123.94 11101 70.27 0.24 2018/8/31 2170 95 100 10 14.80 27 25 126 12 100.49 69.43 0.32 12 2016/9/30 2168 27 837.31 14 35 2149 128.27 105 41 69.54 026 12 2016/1031 2126.15 780.82 15.13 26.81 130.99 103 50 66.38 0.30 14 2016/11/30.2198 81 780.57 19.44 26.08 118.42 100.00 70.17 0.47 15 2016/12/30 2238 33 749 87 20.34 25 41 115 05 103.52 72.55 0.48 16 2017/1831 2278.37 823.48 20.84 2708 130 32 101.75 67.43 0.50 17 201712/28 2363.64 $45.04 22.72 30.13 13554 110.53 65.00 052 201703/31 2362.72 00:54 21.70 28.79 542.08 112.05 65.52 0.74 20171228 2334 20 924 99 21.55 30 20 150 25 111 67 66 23 0.78 20 201710131 2411.60 99482 20.70 28.03 151.46 116.76 6591 0.95 20 2017/6/30 24234199.00 2247 2763 150.9 12044 06.10 0.00 201717/01 240 30987.TR 22.44 28 22 189 25 120 83 4.05 23 2017/031 2471 650.00 22.24 201719 121.28 63.10 0.00 24 20170928 2519 30 06135 23.50 30.10 170 87 110-12 0778 100 25 2017/03126752 1052 20.50 30.01 1600612773 1.12 2017111736 204711170,70 26.14 33.76 177 18 120.44 80.00 124 27 20171172 2073 61 110 A? 37.00 1467 176.40 12800 69 70 137 201011 27381 14000 2012 378 80 12739 72.84 143 19 2012/28 2713.83 1612.45 3001 4063 170,12 120.60 6384 1.00 10 2010? 1447 715 30.11 1970 118.00 02:00 107 2018 2019 2001 40.71 172.0011736 006 10 12 2011 270527 000.00 30 20 10176 111 80 60.17 1.07 23 2011 20,271010000 29.651143211341 7044 1.00 14 2011 2010 201744 3018172. 17300 40 190 25 12.2012 2015 mo 12672 66.97 2.00 201203 2150 45 OT 73.14 2,16 120101011 2711745001 2004 10.1171 6. 2.28 1801111/30 370 3710 17 200 440 14001 139.00 60 231 30 2013 1017 73.40 40 4110 122.19 90 26 2.30 40 2010131 2704 10 1710.71 4440 100 2001 63 23 201002 274403 2Y83 18.60 16145 150 23 09.44 2:30 20100129 2034 AD 1709 75 245 50.74 16.9 133 24 2014 2945 29279.02.1990 4 2019/5/31 2752.06 1775.07 2019/6/28 294176 1893.63 2019/7/31 2980.38 1866.78 2019/8/30 2926 46 1776.29 2019/9/30 2976.74 1735.91 2019/10/31 3037 56 1776.66 2019/11/29 3140.98 1800 80 2019/12/31 3230.78 1847 84 2020/1/31 3225.52 2008.72 2020/2/28 2954 22 188375 2020/3/31 2584.59 1949.72 2020/4/30 291243 2474.00 2020/5/29 3044 31 2442.37 20206/30 3100 29 2758.82 2020/7/31 3271.12 3164.68 2020/8/31 3500 31 3450.96 202070303363.00 3148 73 2020/10/30 3200 96 3036.15 2020/11/30 362163 3168.04 2020/12/30 3732.04 3285.85 25.46 49.21 17747 125.88 82.89 2.29 27.91 51.76 193.00 133.66 68.10 205 29.52 52.73 194.23 124.98 66.08 203 26.47 44.55 18567 124.10 61.61 193 28.25 47.03 178.08 125.09 63.53 1.77 30.29 45 56 191,65 127.66 60.79 1.50 32 27 43,45 201.64 133.85 6204 1.56 34 30 45.99 205.25 14201 63.54 31.97 44 41 20191 144.93 56 57 1.51 27.76 38.57 192.47 131.76 47.51 1.23 20.81 37.98 166 80 128.47 3507 23.57 41.33 204.71 147.00 42 92 0.09 23.54 46.63 225.00 146.75 4281 0.13 23.44 45 48 227.07 138.74 4211 0.14 24.55 46.29 253 67 143.80 39.62 0.00 2540 41.50 293.20 15235 38 35 0.10 23.94 38 72 261.90 147 85 32.90 0.00 23.55 35 61 203 11 136.10 31,32 0.08 27.99 42.67 276.97 144.80 0.00 29.08 44.12 27187 156.05 40 01 007 0.03 3749 65.54 go 273 -- 210 100 10440 130.00 2741 23 22 Sheet Real Data. Spreadsheet file Project2_Data.xlsx contains the closing prices for stocks of six large companies and the values of the S&P 500 Index (SPX) over the 5-year period from December 2015 to 2020. The six companies are Amazon (AMZN), Bank of America (BAC), Cisco Systems (CSCO), Facebook (FB), Johnson & Johnson (JNJ), and Exxon Mobil (XOM). Also included is yield for Tbills. 1. Compute monthly excess returns for SPX and each of the six stocks. Use formulas Gross Return = (Price This Month - Price Last Month)/(Price Last Month). Excess Return = Gross Return - Risk-free rate. Note that Thill rate is annualized and given in percent. Therefore, to get the monthly risk-free rate, divide Thill rate by 100*12. 2. Estimate the sample average returns and sample standard deviations for SPX and each of the six stocks. Use functions AVERAGE and STDEV. In financial press, average returns and standard deviations are usually annualized. To convert to annual figures, multiple monthly average return by 12 and monthly standard deviation by the square root of 12. 3. Estimate the correlations for SPX and each of the six stocks by calculating the sample correlations in the historical data. 4. Which of the six stocks has the lowest correlation with SPX? Plot a scatter diagram of that stock excess return versus the SPX excess retum. On a different chart, plot the cumulative gross retums of that stock and SPX over time starting from December 2015. Repeat this step but now for the stock that has the highest correlation with SPX. (Overall, you will have 4 plots for this step.) The cumulative gross retum is the return realized from December 2015 to the current month, that is, tin Poturn (Price This Month)/(Price in December 2015). 14 : x x M N 0 P o R 15 151 B D E F Along Des AMZN BAC CSO NJ MOM The 2015/12/31 2043.94 675.89 15.25 22.94 104.68 89.76 60 52 0.15 2016/1/29 1940 24 587.00 12.82 20.25 112.21 91.26 50.44 0.30 2012/29 1932.23 552.52 11.36 22 28 106.92 82.60 62.79 0.31 2016/3/31 2059.74 593.64 12.30 24.23 114.10 95.23 65.49 0.19 7 2016/4/29 2006 30 659 59 13.25 23.61 11758 98.56 89 25 0.19 2016/5/31 209695 722.79 13.46 24.95 118.81 99.89 70.33 0.28 D 2016/6/30 2098.86 715.62 12.11 2464 114 28 107.52 74.05 0.25 10 2016/7/29 2173 80 758.89 13.23 26.48 123.94 11101 70.27 0.24 2018/8/31 2170 95 100 10 14.80 27 25 126 12 100.49 69.43 0.32 12 2016/9/30 2168 27 837.31 14 35 2149 128.27 105 41 69.54 026 12 2016/1031 2126.15 780.82 15.13 26.81 130.99 103 50 66.38 0.30 14 2016/11/30.2198 81 780.57 19.44 26.08 118.42 100.00 70.17 0.47 15 2016/12/30 2238 33 749 87 20.34 25 41 115 05 103.52 72.55 0.48 16 2017/1831 2278.37 823.48 20.84 2708 130 32 101.75 67.43 0.50 17 201712/28 2363.64 $45.04 22.72 30.13 13554 110.53 65.00 052 201703/31 2362.72 00:54 21.70 28.79 542.08 112.05 65.52 0.74 20171228 2334 20 924 99 21.55 30 20 150 25 111 67 66 23 0.78 20 201710131 2411.60 99482 20.70 28.03 151.46 116.76 6591 0.95 20 2017/6/30 24234199.00 2247 2763 150.9 12044 06.10 0.00 201717/01 240 30987.TR 22.44 28 22 189 25 120 83 4.05 23 2017/031 2471 650.00 22.24 201719 121.28 63.10 0.00 24 20170928 2519 30 06135 23.50 30.10 170 87 110-12 0778 100 25 2017/03126752 1052 20.50 30.01 1600612773 1.12 2017111736 204711170,70 26.14 33.76 177 18 120.44 80.00 124 27 20171172 2073 61 110 A? 37.00 1467 176.40 12800 69 70 137 201011 27381 14000 2012 378 80 12739 72.84 143 19 2012/28 2713.83 1612.45 3001 4063 170,12 120.60 6384 1.00 10 2010? 1447 715 30.11 1970 118.00 02:00 107 2018 2019 2001 40.71 172.0011736 006 10 12 2011 270527 000.00 30 20 10176 111 80 60.17 1.07 23 2011 20,271010000 29.651143211341 7044 1.00 14 2011 2010 201744 3018172. 17300 40 190 25 12.2012 2015 mo 12672 66.97 2.00 201203 2150 45 OT 73.14 2,16 120101011 2711745001 2004 10.1171 6. 2.28 1801111/30 370 3710 17 200 440 14001 139.00 60 231 30 2013 1017 73.40 40 4110 122.19 90 26 2.30 40 2010131 2704 10 1710.71 4440 100 2001 63 23 201002 274403 2Y83 18.60 16145 150 23 09.44 2:30 20100129 2034 AD 1709 75 245 50.74 16.9 133 24 2014 2945 29279.02.1990 4 2019/5/31 2752.06 1775.07 2019/6/28 294176 1893.63 2019/7/31 2980.38 1866.78 2019/8/30 2926 46 1776.29 2019/9/30 2976.74 1735.91 2019/10/31 3037 56 1776.66 2019/11/29 3140.98 1800 80 2019/12/31 3230.78 1847 84 2020/1/31 3225.52 2008.72 2020/2/28 2954 22 188375 2020/3/31 2584.59 1949.72 2020/4/30 291243 2474.00 2020/5/29 3044 31 2442.37 20206/30 3100 29 2758.82 2020/7/31 3271.12 3164.68 2020/8/31 3500 31 3450.96 202070303363.00 3148 73 2020/10/30 3200 96 3036.15 2020/11/30 362163 3168.04 2020/12/30 3732.04 3285.85 25.46 49.21 17747 125.88 82.89 2.29 27.91 51.76 193.00 133.66 68.10 205 29.52 52.73 194.23 124.98 66.08 203 26.47 44.55 18567 124.10 61.61 193 28.25 47.03 178.08 125.09 63.53 1.77 30.29 45 56 191,65 127.66 60.79 1.50 32 27 43,45 201.64 133.85 6204 1.56 34 30 45.99 205.25 14201 63.54 31.97 44 41 20191 144.93 56 57 1.51 27.76 38.57 192.47 131.76 47.51 1.23 20.81 37.98 166 80 128.47 3507 23.57 41.33 204.71 147.00 42 92 0.09 23.54 46.63 225.00 146.75 4281 0.13 23.44 45 48 227.07 138.74 4211 0.14 24.55 46.29 253 67 143.80 39.62 0.00 2540 41.50 293.20 15235 38 35 0.10 23.94 38 72 261.90 147 85 32.90 0.00 23.55 35 61 203 11 136.10 31,32 0.08 27.99 42.67 276.97 144.80 0.00 29.08 44.12 27187 156.05 40 01 007 0.03 3749 65.54 go 273 -- 210 100 10440 130.00 2741 23 22 Sheet
Step by Step Solution
There are 3 Steps involved in it

Get step-by-step solutions from verified subject matter experts