

Question: plz help me to plot the 3dxy plot the above function only show the 2px plot The eigenfunction of an electron in a hydrogen atom

plz help me to plot the 3dxy plot
the above function only show the 2px plot
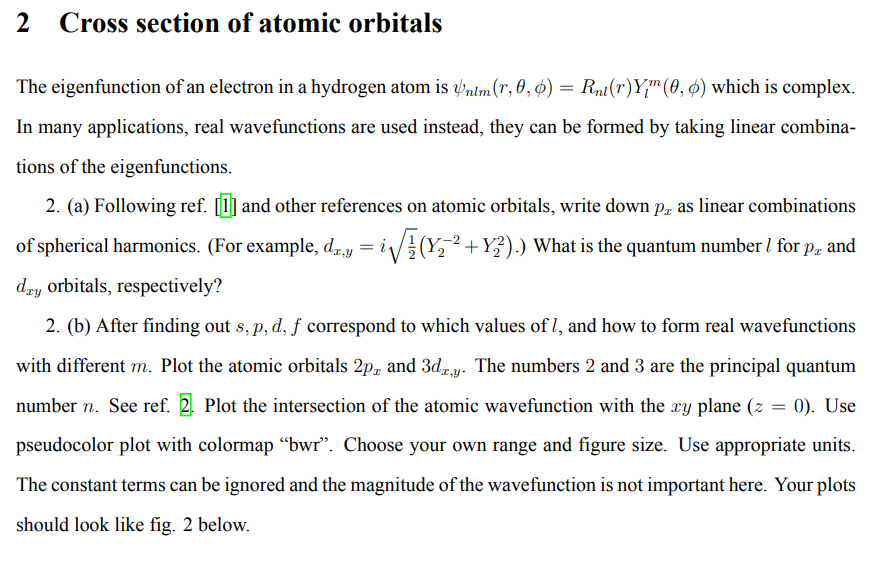
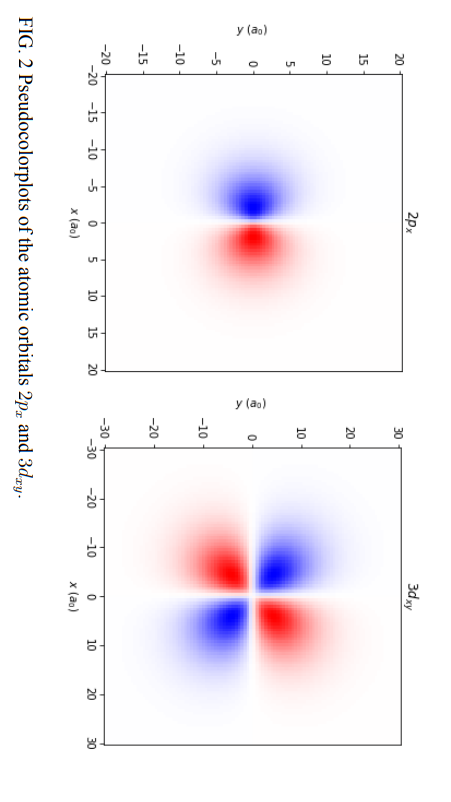
The eigenfunction of an electron in a hydrogen atom is nlm(r,,)=Rnl(r)Ylm(,) which is complex. In many applications, real wavefunctions are used instead, they can be formed by taking linear combinations of the eigenfunctions. 2. (a) Following ref. [1] and other references on atomic orbitals, write down px as linear combinations of spherical harmonics. (For example, dx,y=i21(Y22+Y22).) What is the quantum number l for px and dxy orbitals, respectively? 2. (b) After finding out s,p,d,f correspond to which values of l, and how to form real wavefunctions with different m. Plot the atomic orbitals 2px and 3dx,y. The numbers 2 and 3 are the principal quantum number n. See ref. 2. Plot the intersection of the atomic wavefunction with the xy plane (z=0). Use pseudocolor plot with colormap "bwr". Choose your own range and figure size. Use appropriate units. The constant terms can be ignored and the magnitude of the wavefunction is not important here. Your plots should look like fig. 2 below. FIG. 2 Pseudocolorplots of the atomic orbitals 2px and 3dxy
Step by Step Solution
There are 3 Steps involved in it

Get step-by-step solutions from verified subject matter experts