

Question: Plz provide python code with explanations! begin{tabular}{|rrrrrrrrr|} hline & Date & Open & High & Low & Close & Adj Close & Volume hline
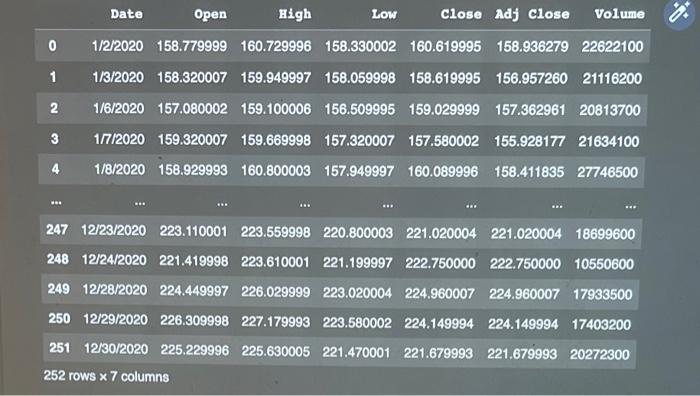
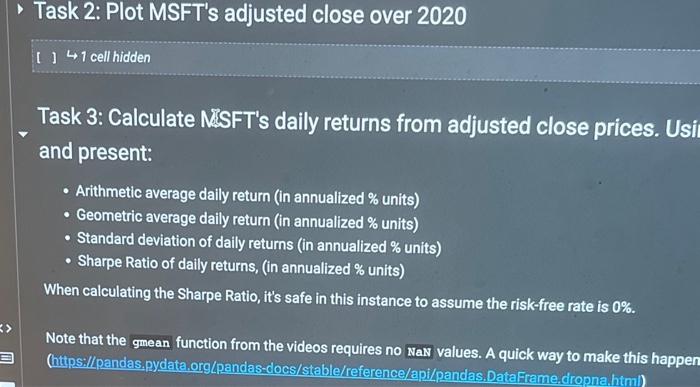
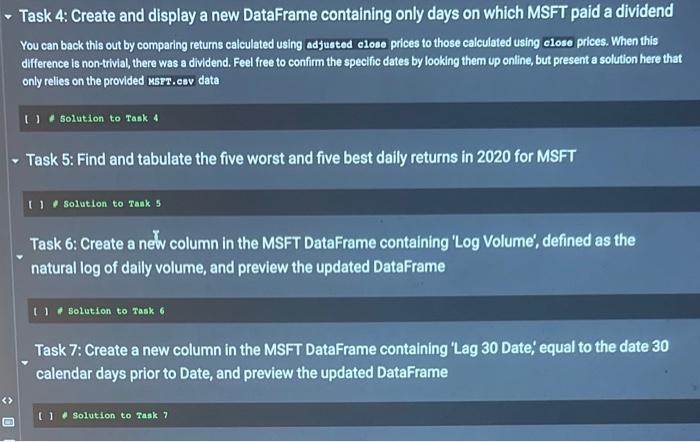
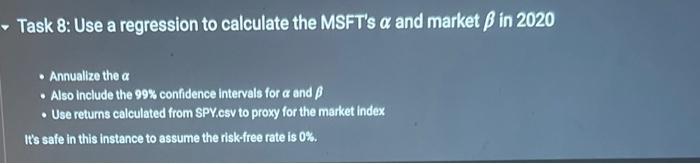
\begin{tabular}{|rrrrrrrrr|} \hline & Date & Open & High & Low & Close & Adj Close & Volume \\ \hline 0 & 1/2/2020 & 158.779999 & 160.729996 & 158.330002 & 160.619995 & 158.936279 & 22622100 \\ \hline 1 & 1/3/2020 & 158.320007 & 159.949997 & 158.059998 & 158.619995 & 156.957260 & 21116200 \\ \hline 2 & 1/6/2020 & 157.080002 & 159.100006 & 156.509995 & 159.029999 & 157.362961 & 20813700 \\ \hline 3 & 1/7/2020 & 159.320007 & 159.669998 & 157.320007 & 157.580002 & 155.928177 & 21634100 \\ \hline 4 & 1/8/2020 & 158.929993 & 160.800003 & 157.949997 & 160.089996 & 158.411835 & 27746500 \\ \hline & & & & & & & & \\ \hline 247 & 12/23/2020 & 223.110001 & 223.559998 & 220.800003 & 221.020004 & 221.020004 & 18699600 \\ \hline 248 & 12/24/2020 & 221.419998 & 223.610001 & 221.199997 & 222.750000 & 222.750000 & 10550600 \\ \hline 249 & 12/28/2020 & 224.449997 & 226.029999 & 223.020004 & 224.960007 & 224.960007 & 17933500 \\ \hline 250 & 12/29/2020 & 226.309998 & 227.179993 & 223.580002 & 224.149994 & 224.149994 & 17403200 \\ \hline 251 & 12/30/2020 & 225.229996 & 225.630005 & 221.470001 & 221.679993 & 221.679993 & 20272300 \\ \hline 252 rows 7 columns & & & & & & & \\ \hline \end{tabular} Task 3: Calculate NSSFT's daily returns from adjusted close prices. Usi and present: - Arithmetic average daily return (in annualized \% units) - Geometric average daily return (in annualized \% units) - Standard deviation of daily returns (in annualized \% units) - Sharpe Ratio of daily returns, (in annualized \% units) When calculating the Sharpe Ratio, it's safe in this instance to assume the risk-free rate is 0%. Note that the gmean function from the videos requires no Nav values. A quick way to make this happer (https:/Lpandas,pydata.org/pandas-docs/stable/reference/api/pandas, DataFrame,droona himi) Task 4: Create and display a new DataFrame containing only days on which MSFT paid a dividend You can back this out by comparing returns calculated using adjusted elose prices to those calculated using elose prices. When this difference is non trivial, there was a dividend. Feel free to confirm the specific dates by looking them up online, but present a solution here that only relies on the provided usrr.cav data (1) solution to Task 4 Task 5: Find and tabulate the five worst and five best daily returns in 2020 for MSFT ( ) solution to Task 5 Task 6: Create a new column in the MSFT DataFrame containing 'Log Volume', defined as the natural log of dally volume, and preview the updated DataFrame (1) Solution to raak 6 Task 7: Create a new column in the MSFT DataFrame containing 'Lag 30 Date', equal to the date 30 calendar days prior to Date, and preview the updated DataFrame [1 Solution to rask? Task 8: Use a regression to calculate the MSFT's and market in 2020 - Annualize the - Also include the 99% confidence intervals for and - Use returns calculated from SPY.csv to proxy for the market index It's safe in this instance to assume the risk-free rate is 0%
Step by Step Solution
There are 3 Steps involved in it

Get step-by-step solutions from verified subject matter experts