

Question: point(s) possible Check here for instructional material to complete this problem a. Plot the data points Then draw a linear model. Let g be the
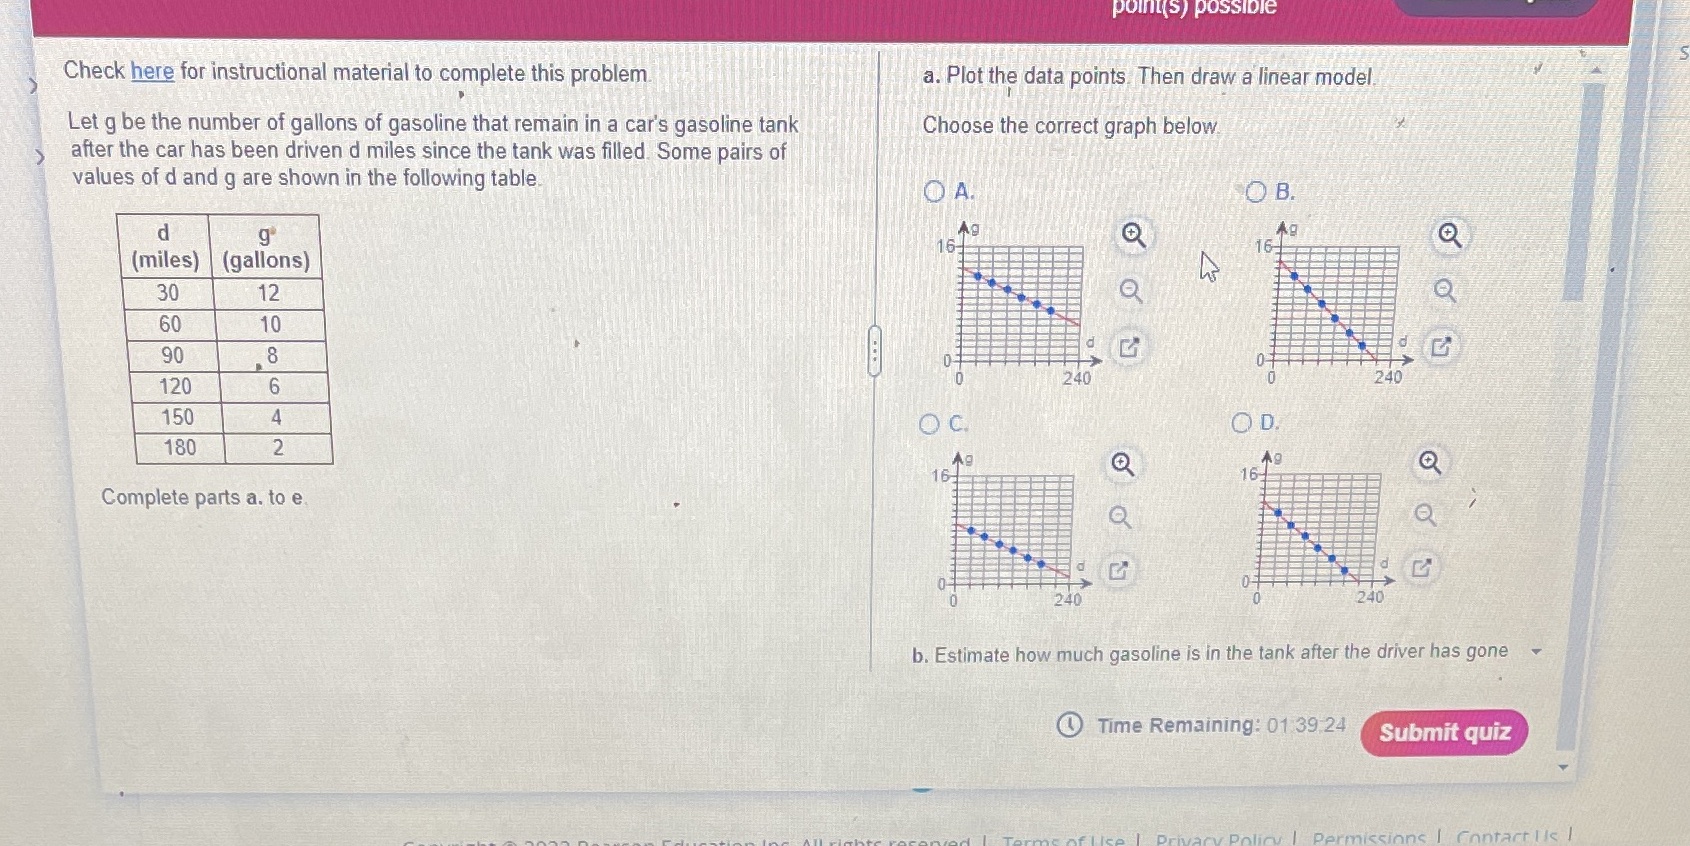
point(s) possible Check here for instructional material to complete this problem a. Plot the data points Then draw a linear model. Let g be the number of gallons of gasoline that remain in a car's gasoline tank Choose the correct graph below after the car has been driven d miles since the tank was filled. Some pairs of values of d and g are shown in the following table. OA. OB. d g' Ag (miles) (gallons) 16- 16- 30 12 60 10 90 8 d 120 6 240 240 150 4 O C. OD. 180 2 16- Complete parts a. to e Q 240 b. Estimate how much gasoline is in the tank after the driver has gone Time Remaining: 01 39.24 Submit quiz Enntact Is 1
Step by Step Solution
There are 3 Steps involved in it
1 Expert Approved Answer
Step: 1 Unlock

Question Has Been Solved by an Expert!
Get step-by-step solutions from verified subject matter experts
Step: 2 Unlock
Step: 3 Unlock