

Question: Check here for instructional material to complete this problem. a. Plot the data points. Then draw a linear model. Let g be the number of
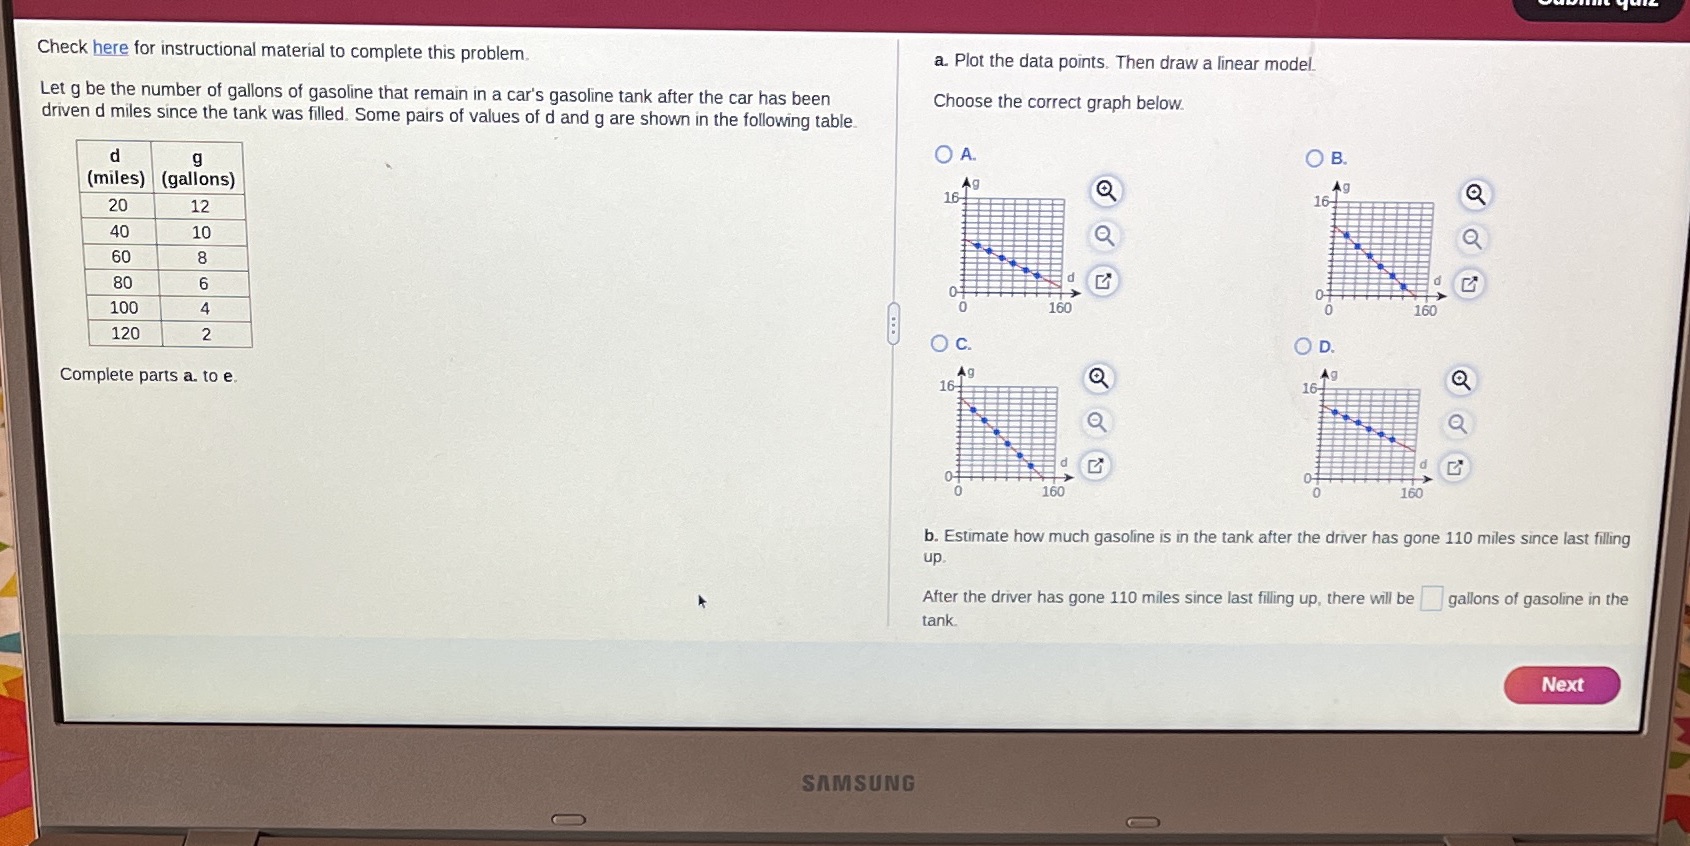
Check here for instructional material to complete this problem. a. Plot the data points. Then draw a linear model. Let g be the number of gallons of gasoline that remain in a car's gasoline tank after the car has been Choose the correct graph below. driven d miles since the tank was filled. Some pairs of values of d and g are shown in the following table. d O A. g O B. (miles) (gallons) Ag Ag 16- 16- 20 12 40 10 60 8 80 6 100 4 160 160 120 2 O C. OD. Ag Ag Complete parts a. to e 161 16- 160 160 b. Estimate how much gasoline is in the tank after the driver has gone 110 miles since last filling up After the driver has gone 110 miles since last filling up, there will be gallons of gasoline in the tank Next SAMSUNG
Step by Step Solution
There are 3 Steps involved in it

Get step-by-step solutions from verified subject matter experts