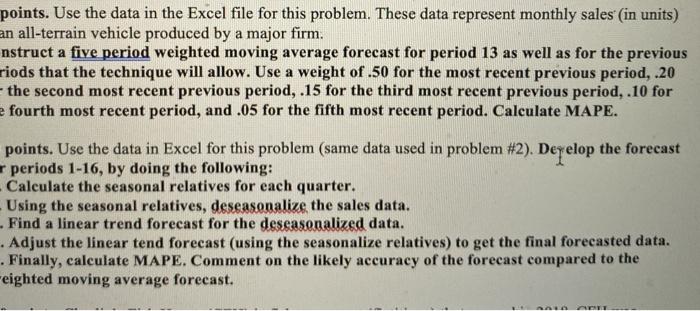
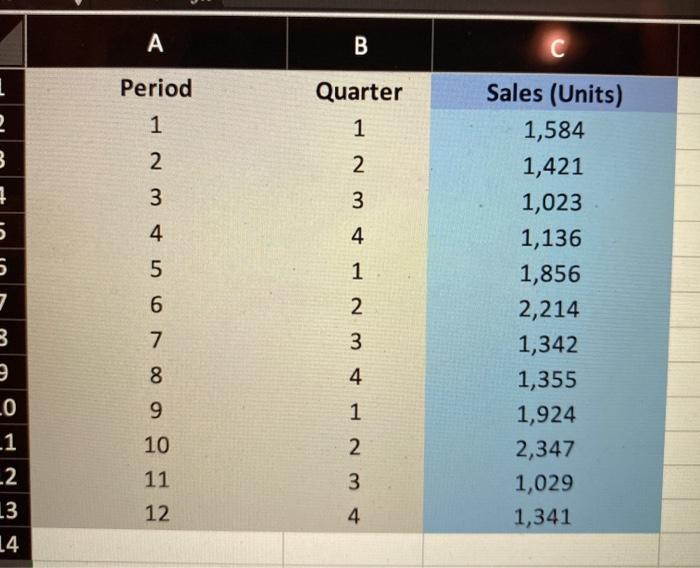
Question: points. Use the data in the Excel file for this problem. These data represent monthly sales (in units) an all-terrain vehicle produced by a major

points. Use the data in the Excel file for this
points. Use the data in the Excel file for this problem. These data represent monthly sales (in units) an all-terrain vehicle produced by a major firm. nstruct a five period weighted moving average forecast for period 13 as well as for the previous riods that the technique will allow. Use a weight of .50 for the most recent previous period, .20 the second most recent previous period, .15 for the third most recent previous period, 10 for e fourth most recent period, and .05 for the fifth most recent period. Calculate MAPE. points. Use the data in Excel for this problem (same data used in problem #2). Dez elop the forecast periods 1-16, by doing the following: Calculate the seasonal relatives for each quarter. - Using the seasonal relatives, deseasonalize the sales data. Find a linear trend forecast for the deseasonalized data. . Adjust the linear tend forecast (using the seasonalize relatives) to get the final forecasted data. . Finally, calculate MAPE. Comment on the likely accuracy of the forecast compared to the eighted moving average forecast. A B 1 Period Quarter 2 1 3 7 5 5 7 3 0 0 No A NEW NEW NE Sales (Units) 1,584 1,421 1,023 1,136 1,856 2,214 1,342 1,355 1,924 2,347 1,029 1,341 8 9 10 0 _1 _2 13 14 3 11 12 4

Step by Step Solution

There are 3 Steps involved in it

1 Expert Approved Answer
Step: 1 Unlock blur-text-image
Question Has Been Solved by an Expert!

Get step-by-step solutions from verified subject matter experts

Step: 2 Unlock
Step: 3 Unlock

Students Have Also Explored These Related General Management Questions!