

Question: Polar plotting in matlab Question number two is the one i need help on. I don't know how to polar plot it in the interval
Polar plotting in matlab
Question number two is the one i need help on. I don't know how to polar plot it in the interval of [0,4pi]. I can do it on [0,2pi] but that is not what it is asking for
R(theta) = 3*sin(3*cos(0.5*(theta)))
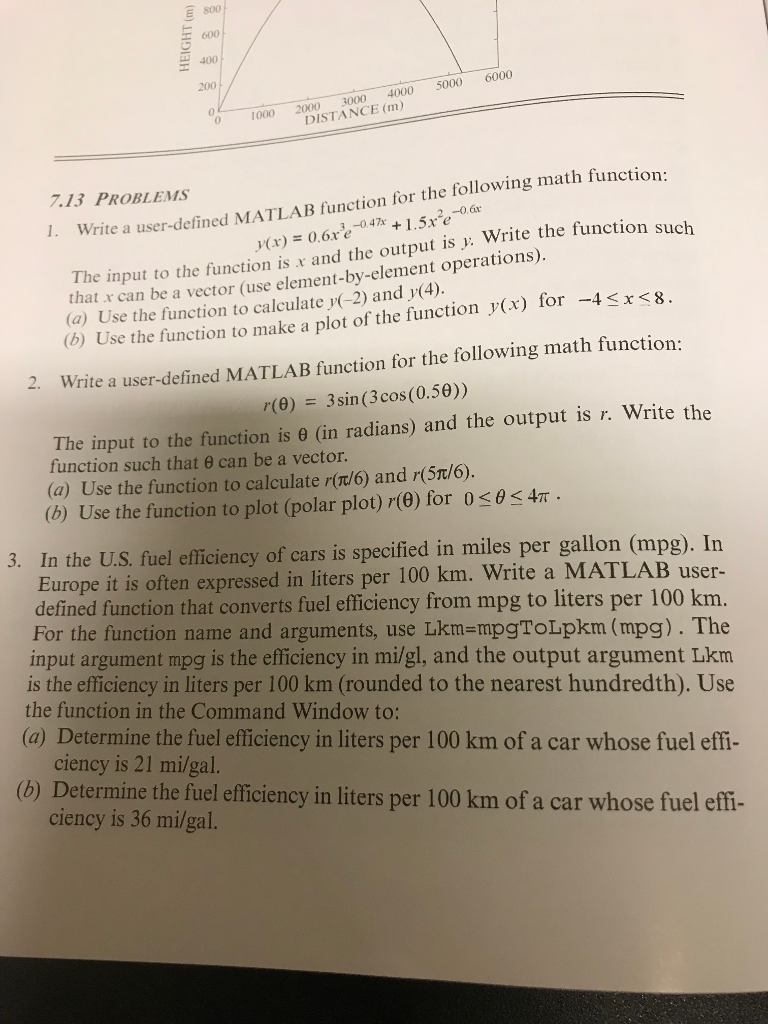
E 800 600 400 200 0 0 1000 2000 3000 4000 5000 6000 DISTANCE (m) 7.13 PROBLEMS 1. Write a user-defined MATLAB function for the following math function: The input to the function is r and the output is y. Write the function such that r can be a vector (use element-by-element operations) (a) Use the function to calculate(-2) and y(4). (b) Use the function to make a plot of the function y(x) for -4
Step by Step Solution
There are 3 Steps involved in it
1 Expert Approved Answer
Step: 1 Unlock

Question Has Been Solved by an Expert!
Get step-by-step solutions from verified subject matter experts
Step: 2 Unlock
Step: 3 Unlock