

Question: POLYNOMIAL FUNCTIONS are very useful for modeling sociological data, such as economic or behavioral trends, which may both increase and decrease over time. A QUADRATIC
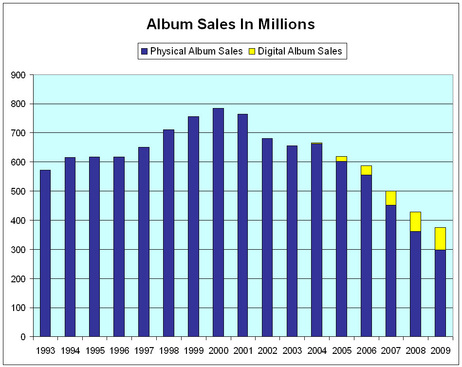
POLYNOMIAL FUNCTIONS are very useful for modeling sociological data, such as economic or behavioral trends, which may both increase and decrease over time. A QUADRATIC FUNCTION is a 2nd-degree polynomial. The graphs of quadratic functions are parabola-shaped; they turn around exactly once. If we look very closely, the graph below appears to turn around three times: after the years 2000, 2003, and 2004. But when observing trends over a period of time, it's common to ignore small fluctuations that don't influence the overall trend. Thus, we might reasonably omit the fluctuations in 2003 and 2004, and simply say that album sales peaked in 2000 and have been decreasing since. The long-term trend is a quadratic function with a negative leading coefficient. The vertex of the graph represents the peak sales in 2000.
Source: RIAA
Your Deliverables:
1. Give one real-life application of quadratic functions? Support it with a graph, if you find one. Cite your source/s.
\f
Step by Step Solution
There are 3 Steps involved in it

Get step-by-step solutions from verified subject matter experts