

Question: POSITION vs . TIME GRAPH a . Plot position ( m ) vs . time using a scatter plot. b . Title the graph Position
POSITION vs TIME GRAPH
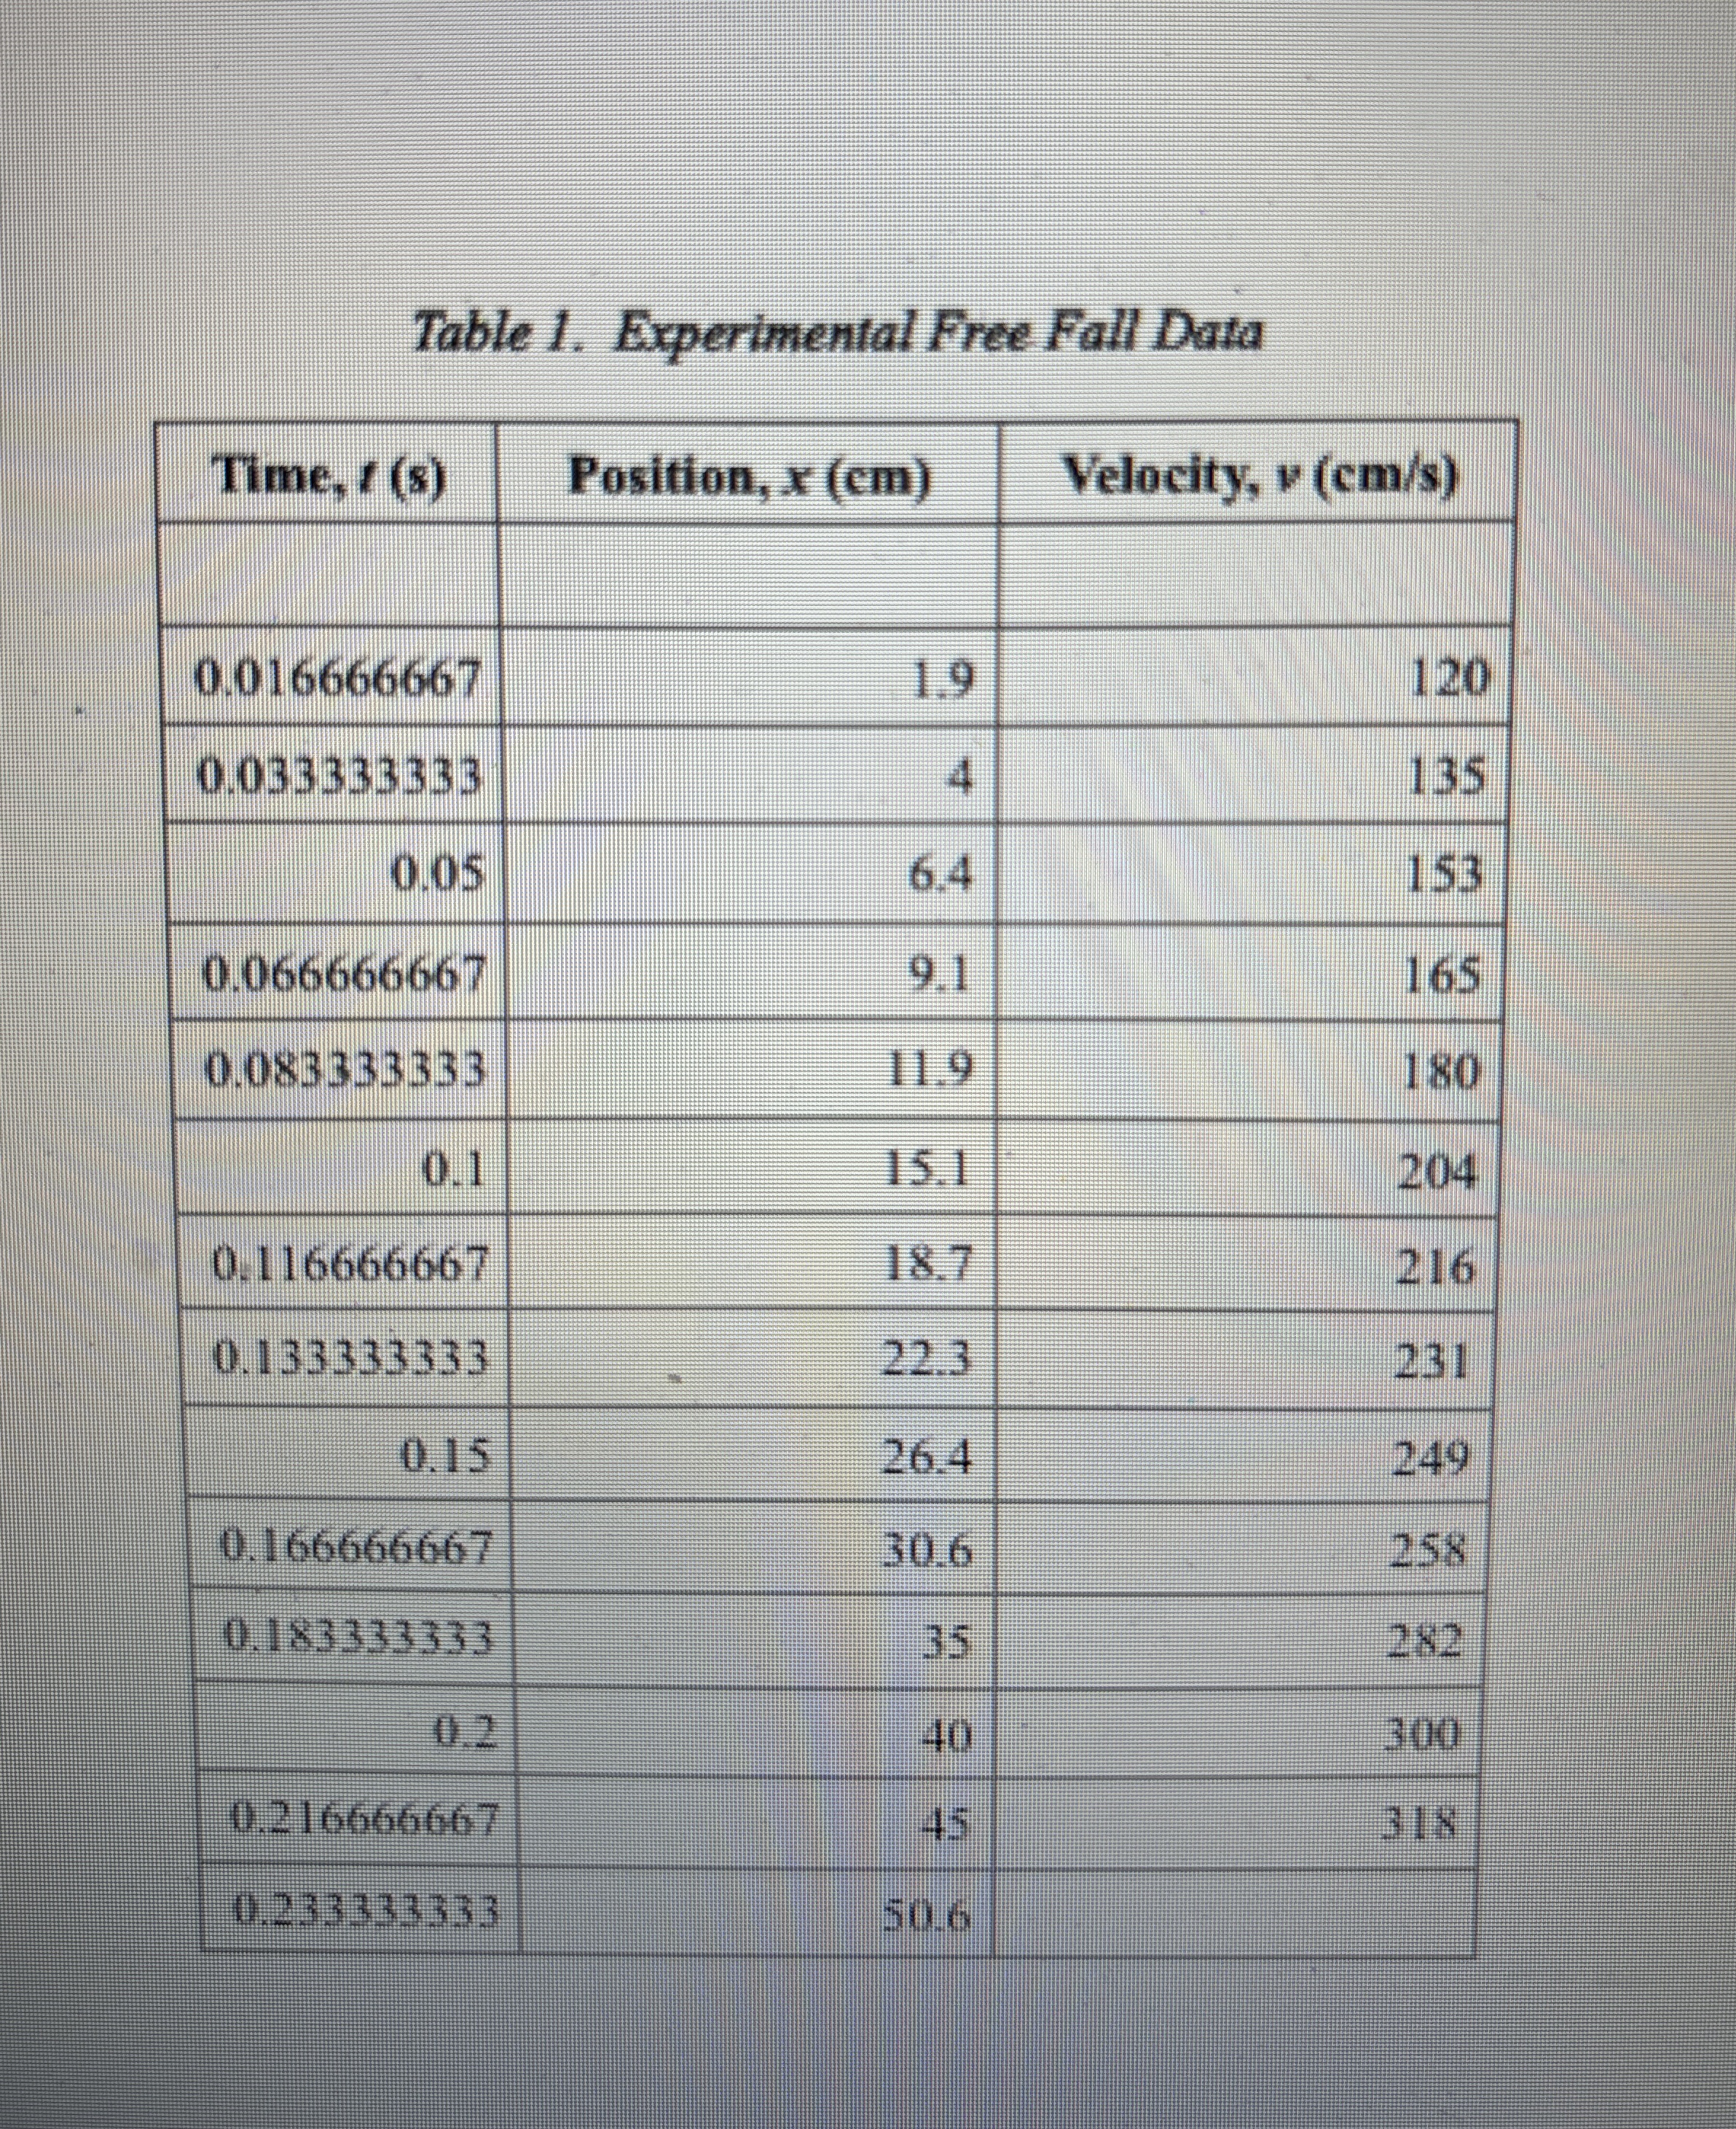
a Plot position m vs time using a scatter plot.
b Title the graph "Position vs TimeFreeFall Motion".
c Be sure to include proper axes and graph titles, units, scale, etc.
d Add a polynomial trendline of degree and include trendline equation and value
on chart.
e Add a chart subtitle.
In the subtitle, indicate the acceleration of the object as given in the trendline
equation, with proper units.
In the subtitle, indicate the error between the acceleration shown in the
equation and the theoretical value.
ii Move chart to new page with tab titled "Position vs Time".
C VELOCITY vs TIME GRAPH
a Plot velocity vs time using a scatter plot.
b Title the graph "Velocity vs TimeFreeFall Motion".
c Be sure to include proper axes and graph titles, units, scale, etc.
d Add a linear trendline; include trendline equation and value on chart.
e Add a chart subtitle and
Indicate the acceleration of the object as given in the trendline equation,
with proper units.
Indicate the error between the acceleration above and the theoretical
value.
f Move chart to new page with tab titled "Velocity vs Time".
D ACCELERATION vs TIME GRAPH
a Plot theoretical acceleration vs time using a scatter plot.
b Title the graph "Acceleration vs TimeFreeFall Motion".
c Be sure to include proper axes and graph titles, units, scale, etc.
d Add a linear trendline; include trendline equation and value on chart.
e Move chart to new page with tab titled "Acceleration vs Time".
Step by Step Solution
There are 3 Steps involved in it
1 Expert Approved Answer
Step: 1 Unlock

Question Has Been Solved by an Expert!
Get step-by-step solutions from verified subject matter experts
Step: 2 Unlock
Step: 3 Unlock