

Question: PowerPoint Tasks ( Putting It All Together ) : After completing your analysis in Excel, prepare one PowerPoint presentation ( 8 - 1 2 slides
PowerPoint Tasks Putting It All Together:
After completing your analysis in Excel, prepare one PowerPoint presentation slides The presentation should include speaker notes and address the following
Introduction Slide Define: Define the problem
Collect Slide: Describe the raw data set and your individual sample data with randomized data records.
Organize and Visualize Slides: Include your pivot tables and bar charts.
Analyze Slides: Include your descriptive statistics on Fare and findings from your three pivot tables and charts, then discuss the impacting factors on surival rate
Conclusion: Compare your data analysis results with a Titanic research fact. Does your sample support the Titanic research facts you found?
References: Cite two or more sources. Documentation of sources should be presented using APA formatting guidelines, which can be found in the APA Style Gui Student Success Center.
Deliverables
One Excel file with all required charts and calucations.
One PowerPoint presentation slides include all the components listed in the "PowerPoint Tasks Putting It All Together section.
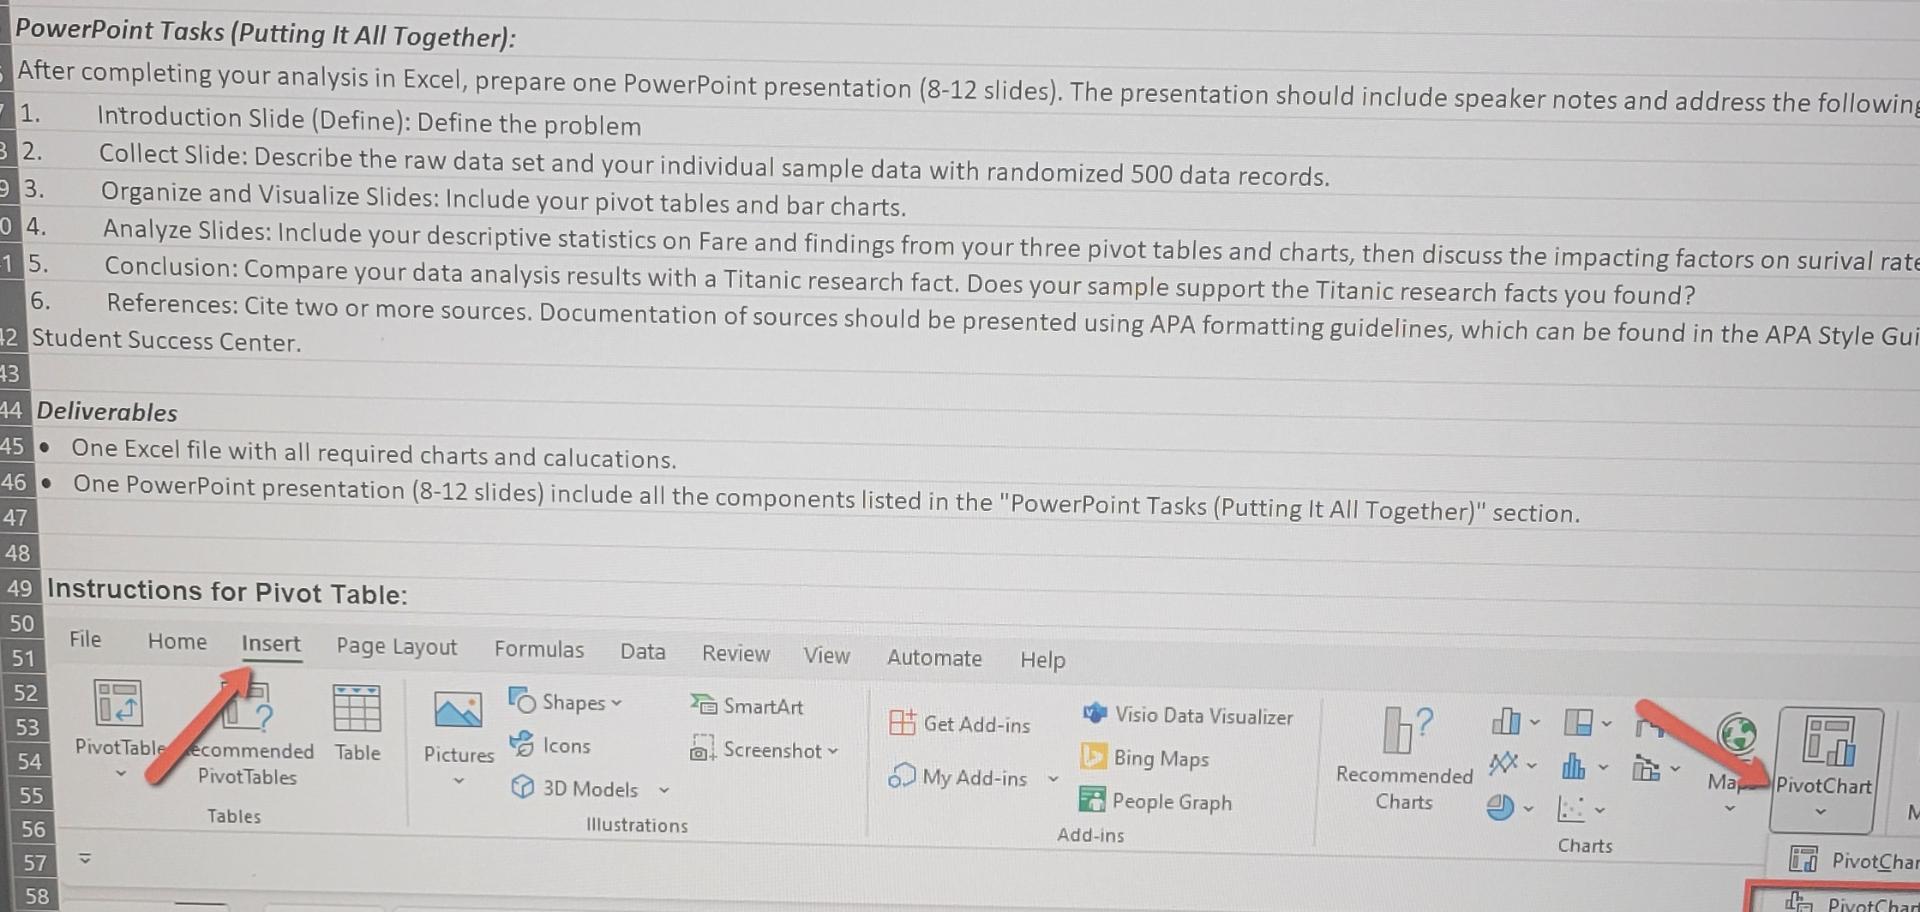
Instructions for Pivot Table:
Step by Step Solution
There are 3 Steps involved in it
1 Expert Approved Answer
Step: 1 Unlock

Question Has Been Solved by an Expert!
Get step-by-step solutions from verified subject matter experts
Step: 2 Unlock
Step: 3 Unlock