

Question: Practice FRQ, 2.3, 2.6, 3.2, 3.7, 4.4 Include correctly labeled diagrams, if useful or required, in explaining your answers. A correctly labeled diagram must have
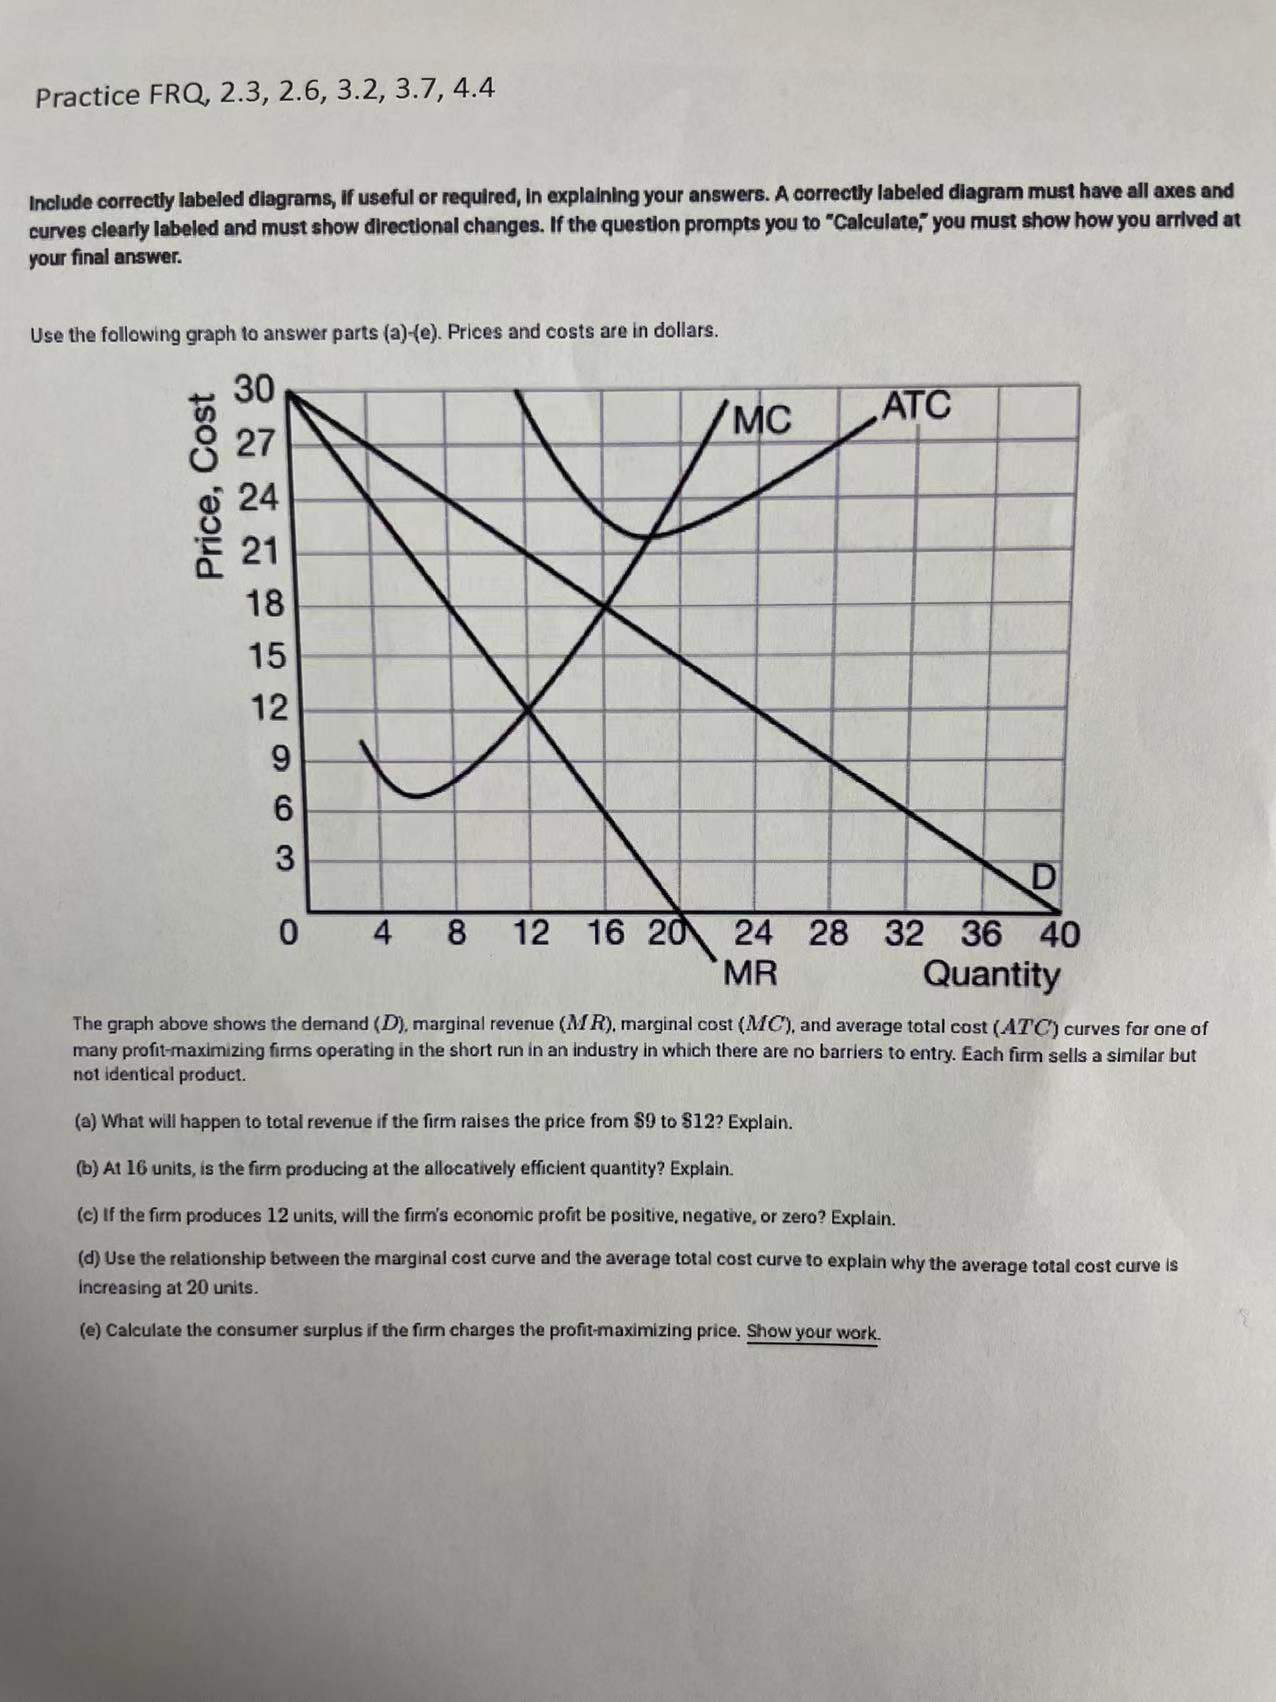
Practice FRQ, 2.3, 2.6, 3.2, 3.7, 4.4 Include correctly labeled diagrams, if useful or required, in explaining your answers. A correctly labeled diagram must have all axes and curves clearly labeled and must show directional changes. If the question prompts you to "Calculate," you must show how you arrived at your final answer. Use the following graph to answer parts (a)-(e). Prices and costs are in dollars. Price, Cost O WONGONNNS D 4 8 12 16 20 24 28 32 36 40 MR Quantity The graph above shows the demand ( D), marginal revenue (MR), marginal cost (1/C), and average total cost (ATC) curves for one of many profit-maximizing firms operating in the short run in an industry in which there are no barriers to entry. Each firm sells a similar but not identical product. (a) What will happen to total revenue if the firm raises the price from $9 to $12? Explain. (b) At 16 units, is the firm producing at the allocationly efficient quantity? Explain. (c) If the firm produces 12 units, will the firm's economic profit be positive, negative, or zero? Explain. (d) Use the relationship between the marginal cost curve and the average total cost curve to explain why the average total cost curve is Increasing at 20 units. (e) Calculate the consumer surplus if the firm charges the profit-maximizing price. Show your work
Step by Step Solution
There are 3 Steps involved in it

Get step-by-step solutions from verified subject matter experts