

Question: Practice Problem # 1 Control Charts for Variables A process that is considered to be in control measures an ingredient in ounces. Blow are the
Practice Problem #
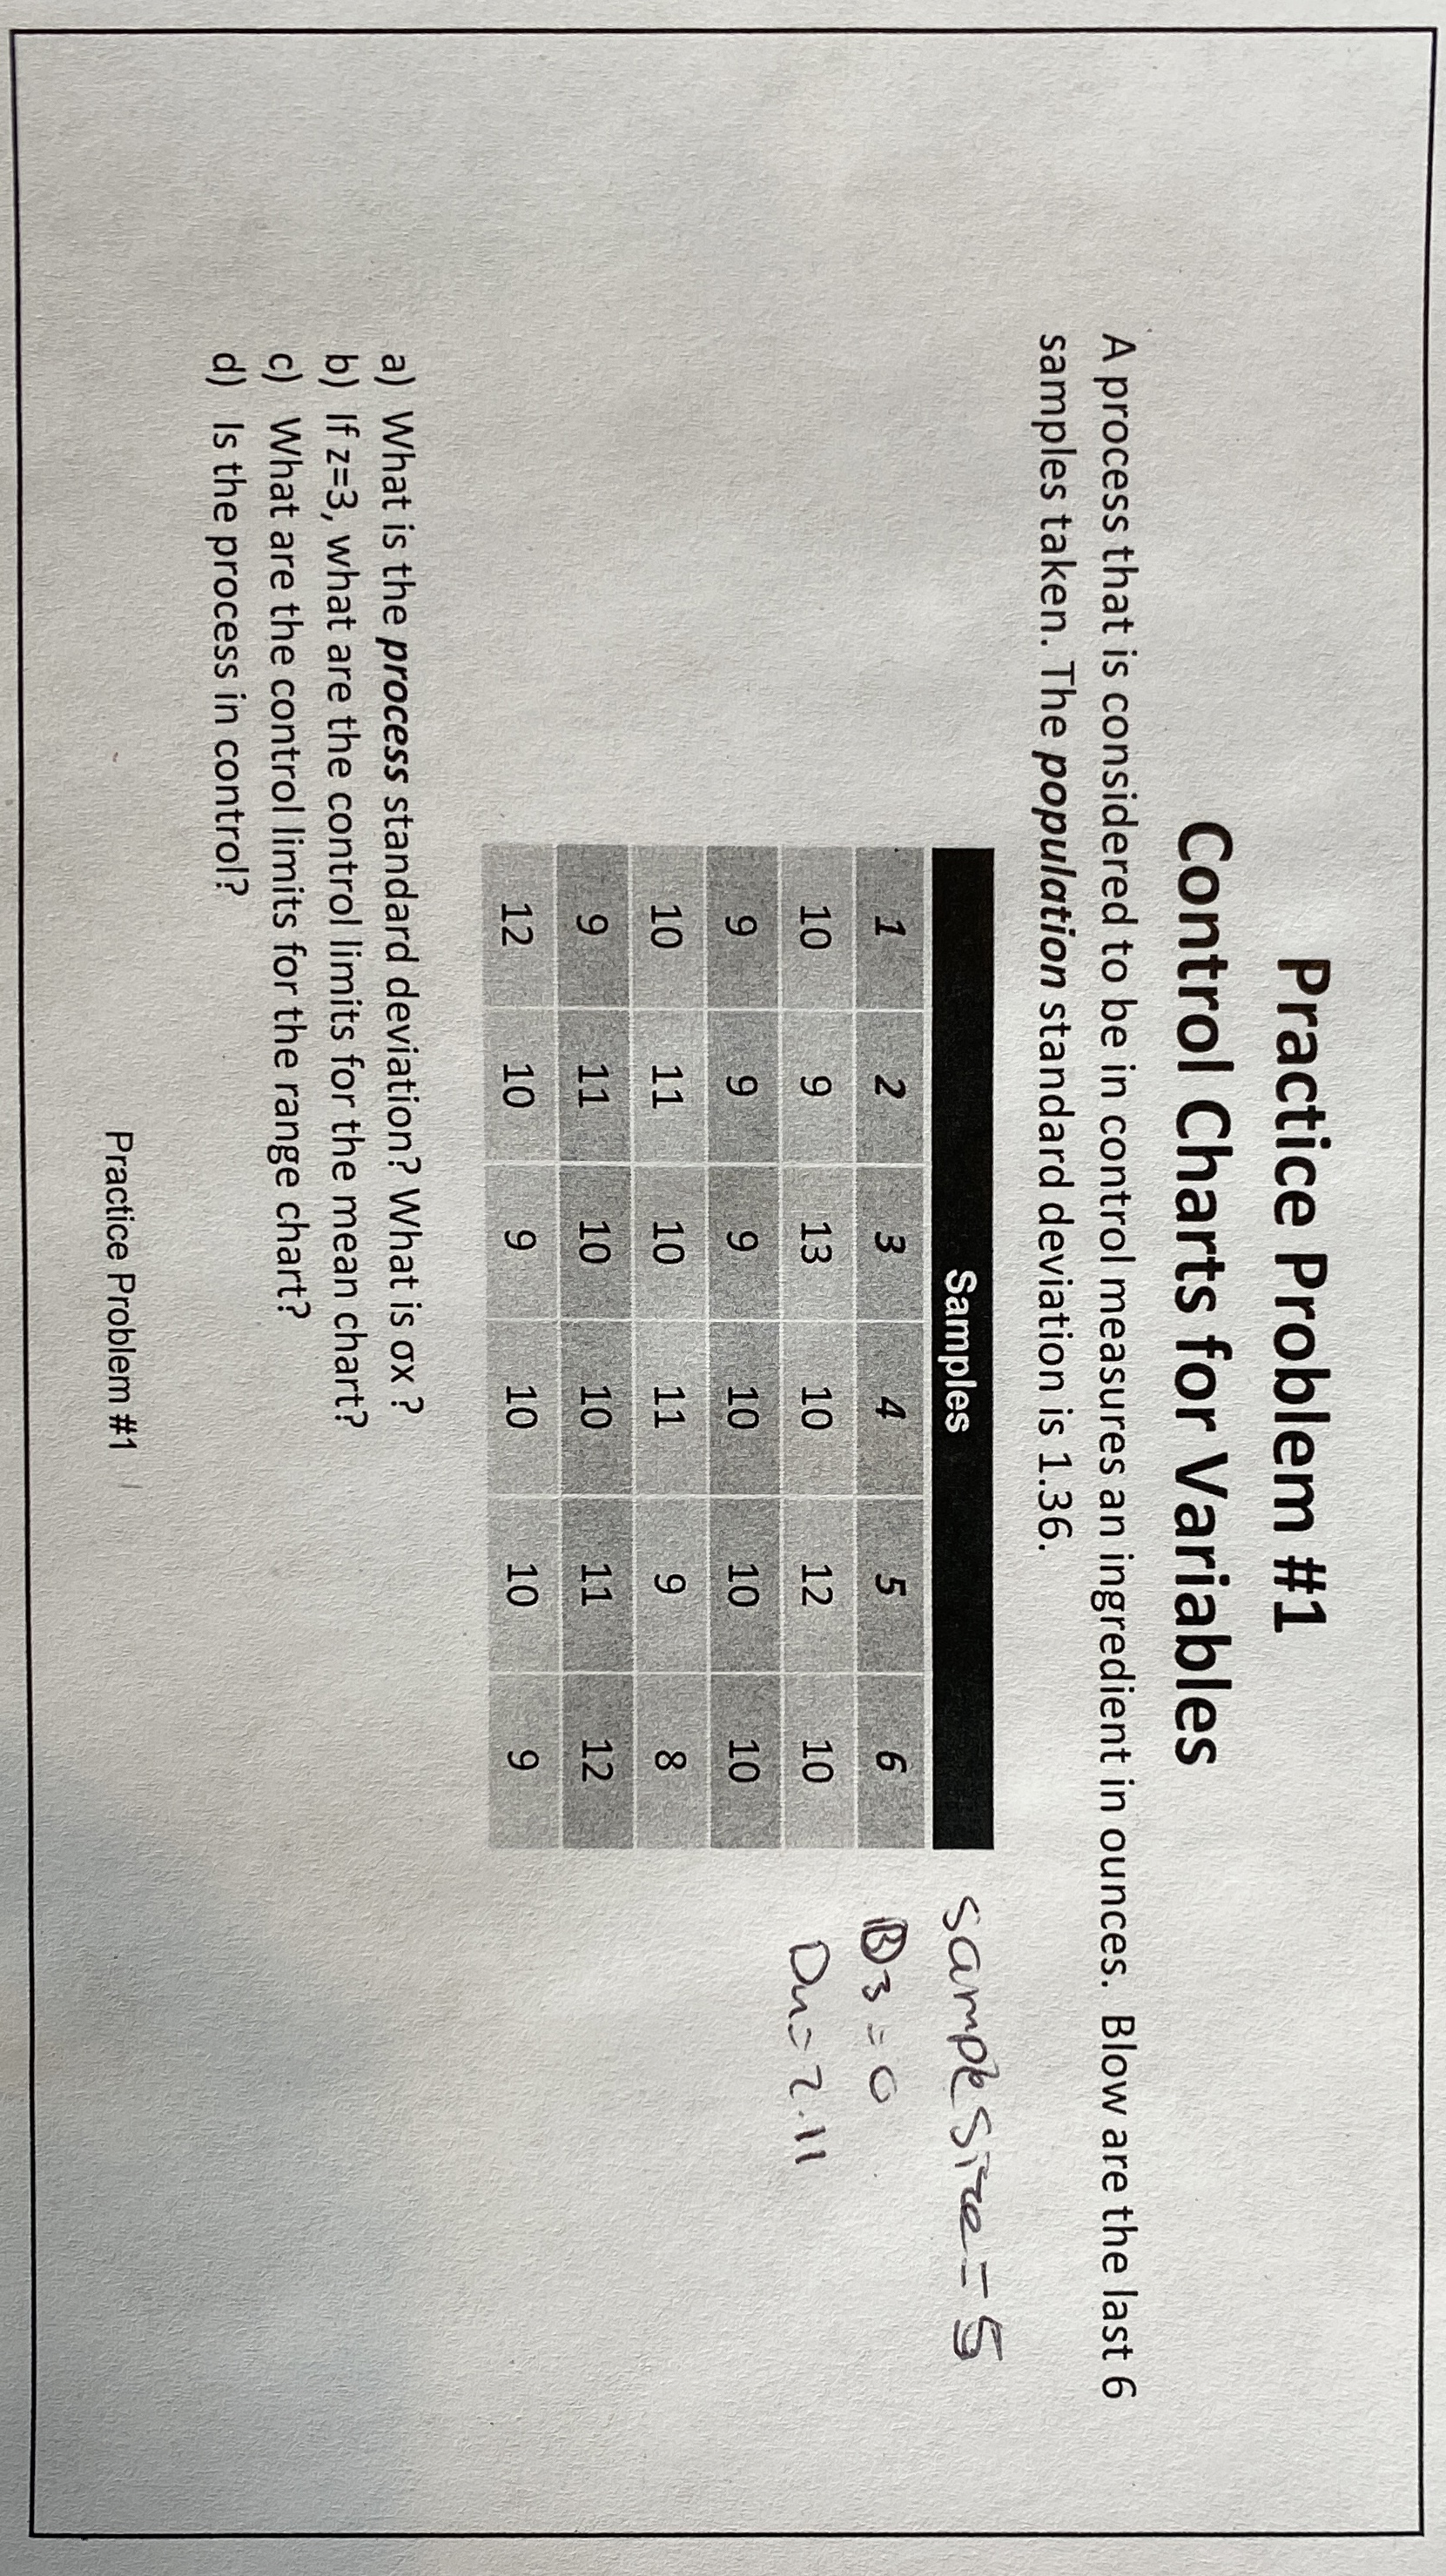
Control Charts for Variables
A process that is considered to be in control measures an ingredient in ounces. Blow are the last samples taken. The population standard deviation is
tableSamples
sampesize
a What is the process standard deviation? What is ox
b If what are the control limits for the mean chart?
c What are the control limits for the range chart?
d Is the process in control?
Practice Problem #
Step by Step Solution
There are 3 Steps involved in it
1 Expert Approved Answer
Step: 1 Unlock

Question Has Been Solved by an Expert!
Get step-by-step solutions from verified subject matter experts
Step: 2 Unlock
Step: 3 Unlock